| Fire incidents reported |
|---|
| Sreet name | Count |
|---|
| MARKET ST | 56 | | NEW PARK RD | 34 | | MAIN ST | 30 | | ANDERSON RD | 18 | | WOODBINE RD | 16 | | DEER RD | 14 | | GRACETON RD | 14 | | BRIDGETON RD | 12 | | DAVIS RD | 12 | | MCDERMOTT RD | 12 | | MILL ST | 12 | | BLUE BALL RD | 10 | | GARVINE MILL RD | 10 | | MITCHELL RD | 10 | | BRYANSVILLE RD | 8 | | BUCKWHEAT RD | 8 | | CAREA RD | 8 | | HUNT CLUB RD | 8 | | MORRIS AVE | 8 | | MORRIS RD | 8 | | MOUNT OLIVET CHURCH RD | 8 | | NACE RD | 8 | | TORBERT RD | 8 | | WEST WOODBINE RD | 8 | | BROWN RD | 6 |
| | | Fire incidents reported |
|---|
| Sreet name | Count |
|---|
| BRUCE RD | 6 | | CEDAR VALLEY RD | 6 | | FAWN GROVE RD | 6 | | KUNKLE RD | 6 | | LOWE RD | 6 | | MAPLE LAWN RD | 6 | | NORTH MCDERMOTT RD | 6 | | THOMPSON RD | 6 | | WATTERS RD | 6 | | FAWN GROVE NEW PARK RD | 4 | | JONES RD | 4 | | NEW PARK FAWN GROVE RD | 4 | | NORTH MARKET ST | 4 | | ORCHARD RD | 4 | | RIDGE RD | 4 | | STONEY LA | 4 | | WALNUT GROVE RD | 4 | | WEST MAPLE LAWN RD | 4 | | WILEY MILL RD | 4 | | WOOLEN MILL RD | 4 | | 347 E WALNUT GROVE RD | 2 | | ALLEN LA | 2 | | ARNOLD RD | 2 | | BALD EAGLE RD | 2 | | BARRENS RD | 2 |
|
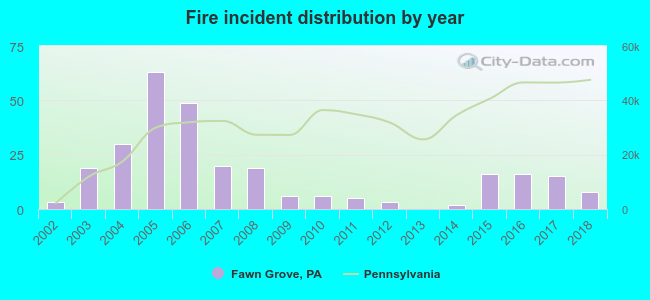 Based on the data from the years 2002 - 2018 the average number of fires per year is 16. The highest number of fire incidents - 63 took place in 2005, and the least - 0 in 2013. The data has an increasing trend.
 42.1% incidents where reported in the morning and 57.9% in the evening. The most fires (21.1%) took place on Thursday, and the least (10.7%) on Friday.
 According to the 280 fire incident reports from years 2002 - 2018 most fires (16.1%) took place during March, and the least (2.9%) in October.
 Out of all 606 cases reported during the years 2002 - 2018, the most belonged to the categories: Fire (46.2%), Rescue & EMS (17.8%), and Good Intent Call (13.2%).
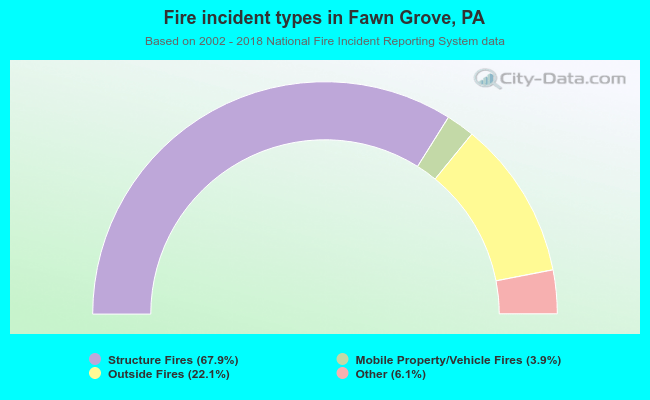 When looking into fire subcategories, the most reports belonged to: Structure Fires (67.9%), and Outside Fires (22.1%).