| Fire incidents reported |
|---|
| Sreet name | Count |
|---|
| GATEWOOD ROAD | 40 | | RT 16 | 32 | | RTE 19 | 26 | | LAUREL CREEK ROAD | 18 | | CROOKED RUN ROAD | 14 | | RT 19 | 14 | | CUNARD ROAD | 10 | | RTE 16 | 10 | | BACHMAN RD | 8 | | CUNARD RD | 8 | | FAYETTE STATION ROAD | 8 | | 332 LAUREL CREEK ROAD | 6 | | 6478 GATEWOOD ROAD | 6 | | BACHMAN ROAD | 6 | | BECKWITH ROAD | 6 | | CUNARD | 6 | | ELIZABETH WAY | 6 | | JENKINS FORK RD | 6 | | LIVELY ST. | 6 | | MAPLE LANE | 6 | | NICKLEVILLE ROAD | 6 | | ROUTE 19 | 6 | | 147 HIGH ST | 4 | | 147 HIGH STREET | 4 | | 1571 CUNARD ROAD | 4 |
| | | Fire incidents reported |
|---|
| Sreet name | Count |
|---|
| 195 WOODLAND LANE | 4 | | 213 LIGHTHOUSE LANE | 4 | | 250 TOURISON ADDITION | 4 | | 2649 COURT ST | 4 | | 372 BARRINGTON HILL RD | 4 | | 375 LEDGEVIEW DRIVE | 4 | | 4H CAMP ROAD | 4 | | 54 CRAIGS BRANCH RD | 4 | | 625 WOLF CREEK ROAD | 4 | | 66 SHADY LANE | 4 | | 68 CUNARD ROAD | 4 | | 83 DEMPSEY RD | 4 | | 87 BENNETT LANE | 4 | | 88 WILLOW LANE | 4 | | 96 JACOBS CORNER | 4 | | AMES HEIGHTS ROAD | 4 | | COURT ST | 4 | | GATEWOOD RD. | 4 | | HAYDEN ST | 4 | | HIGH ST | 4 | | HIGH STREET | 4 | | HINKLE ROAD | 4 | | LAUREL CREEK RD | 4 | | NICKLEVILLE RD | 4 | | PLEASANT VIEW RD | 4 |
|
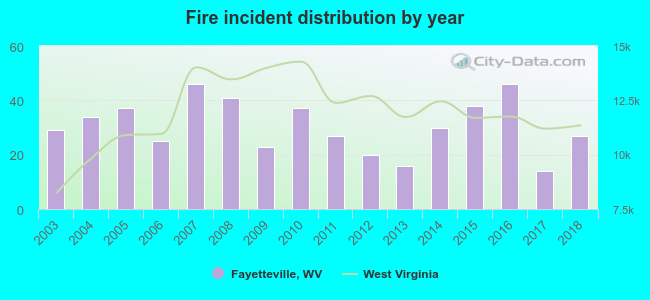 Based on the data from the years 2003 - 2018 the average number of fires per year is 31. The highest number of fires - 46 took place in 2007, and the least - 14 in 2017. The data has a declining trend.
 35.5% incidents where reported in the morning and 64.5% in the evening. The most fires (17.8%) took place on Tuesday, and the least (10.8%) on Wednesday.
 According to the 490 fire incident reports from years 2003 - 2018 most fires (14.3%) took place during March, and the least (4.5%) in October.
 Out of all 1,940 cases reported during the years 2003 - 2018, the most belonged to the categories: Hazardous Condition (53.5%), Fire (25.3%), and Service Call (6.1%).
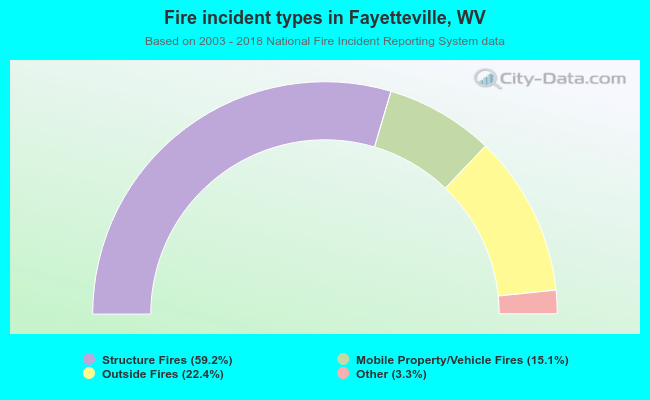 When looking into fire subcategories, the most incidents belonged to: Structure Fires (59.2%), and Outside Fires (22.4%).