| Fire incidents reported |
|---|
| Sreet name | Count |
|---|
| DIETRICH RD | 42 | | HIGHWAY T | 30 | | SERVICE (I-70) RD | 26 | | HIGHWAY W | 22 | | SERVICEI70 RD | 22 | | SCHAPER RD | 18 | | POINT PRAIRIE RD | 16 | | OBERHELMAN RD | 14 | | HIGHWAY 61 | 12 | | SCOTTI RD | 12 | | CLAIREN DR | 8 | | COTTON RD | 8 | | ENGLISH RD | 8 | | FAIRWAY DR | 8 | | HIGHWAY D | 8 | | MEINERSHAGEN RD | 8 | | ROBBY DR | 8 | | SCHULTZ RD | 8 | | SNEAK RD | 8 | | STRINGTOWN RD | 8 | | SUMAC RIDGE DR | 8 | | VILLAGE LN | 8 | | FOREST TRAILS DR | 6 | | HIGHWAY | 6 | | HIGHWAY N | 6 |
| | | Fire incidents reported |
|---|
| Sreet name | Count |
|---|
| HWY T | 6 | | INDIAN CAMP CREEK DR | 6 | | INTERSTATE 70 HWY | 6 | | MADRE DR | 6 | | MORRISON LN | 6 | | OLD COTTON RD | 6 | | PEARCE BLVD | 6 | | RICKY DR | 6 | | ROSE LN | 6 | | SCHNARRE RD | 6 | | SHANE LN | 6 | | SHEPHERD LN | 6 | | VETERANS MEMORIAL PKWY | 6 | | VETERANS MEMORIAL PKY | 6 | | 0 EB INTERSTATE 70 | 4 | | 70 NORTH SERVICE RD | 4 | | ACORN HILL | 4 | | BUBBLING BROOK CT | 4 | | CHATTEAU CT | 4 | | CRICKET HOLLOW CT | 4 | | CRICKET HOLLOW DR | 4 | | ENTRANCE CT | 4 | | FORISTELL RD | 4 | | FREESE HERITAGE LN | 4 | | |
|
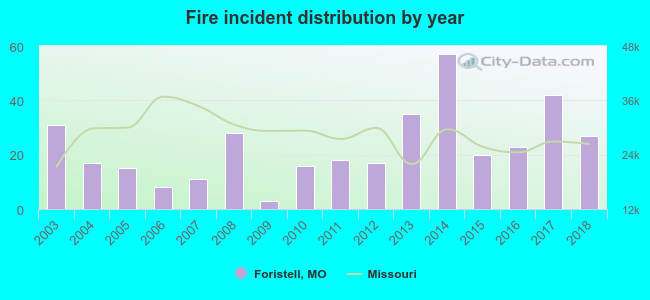 According to the data from the years 2003 - 2018 the average number of fires per year is 23. The highest number of fire incidents - 57 took place in 2014, and the least - 3 in 2009. The data has a declining trend.
 27.2% incidents where reported in the morning and 72.8% in the evening. The most fires (18.2%) took place on Saturday, and the least (12.0%) on Tuesday.
 According to the 368 fire incident reports from years 2003 - 2018 most fires (13.6%) took place during March, and the least (3.8%) in June.
 Out of all 1,615 cases reported during the years 2003 - 2018, the most belonged to the categories: Rescue & EMS (40.1%), Fire (22.8%), and Good Intent Call (17.7%).
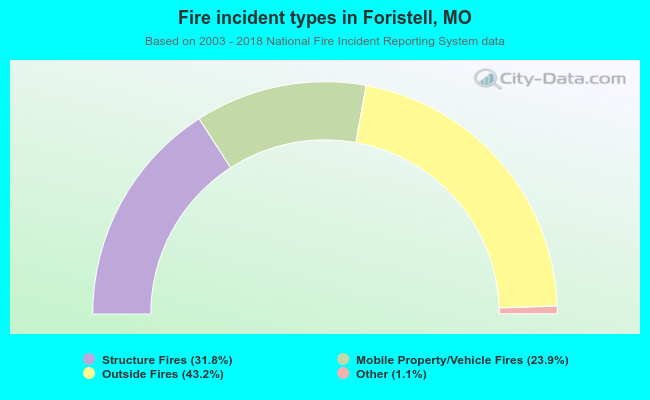 When looking into fire subcategories, the most reports belonged to: Outside Fires (43.2%), and Structure Fires (31.8%).