Forks: Fire Incidents, Washington (WA)
Where are fire incidents reported in Forks, WA
Something went wrong! Please refresh the page.
|
| |||||||||||||||||||||||||||||||||||||||||||||||||||||||||||||||||||||||||||||||||||||||||||||||||||||||||||||
2004 - 2018 National Fire Incident Reporting System (NFIRS) incidents
- Incident types reported to NFIRS in Forks, WA
- 28330.2%Fire
- 22023.5%Hazardous Condition
- 11412.2%Service Call
- 10911.6%Good Intent Call
- 9910.6%False Alarm
- 9410.0%Rescue & EMS
- 101.1%Severe Weather
- 50.5%Special Incident
- 40.4%Overpressure Rupture
- Fire incident types reported to NFIRS in Forks, WA
- 13949.1%Structure Fires
- 7125.1%Outside Fires
- 4415.5%Other
- 2910.2%Mobile Property/Vehicle Fires
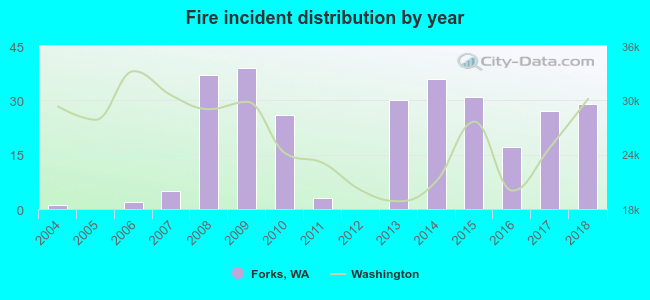 Based on the data from the years 2004 - 2018 the average number of fires per year is 19. The highest number of reported fires - 39 took place in 2009, and the least - 0 in 2005. The data has an increasing trend.
 31.4% incidents where reported in the morning and 68.6% in the evening. The most fires (17.3%) took place on Wednesday, and the least (11.7%) on Thursday.
 Based on the 283 fire incident reports from years 2004 - 2018 most fires (10.6%) took place during November, and the least (6.4%) in February.
 Out of all 938 cases reported during the years 2004 - 2018, the most belonged to the categories: Fire (30.2%), Hazardous Condition (23.5%), and Service Call (12.2%).
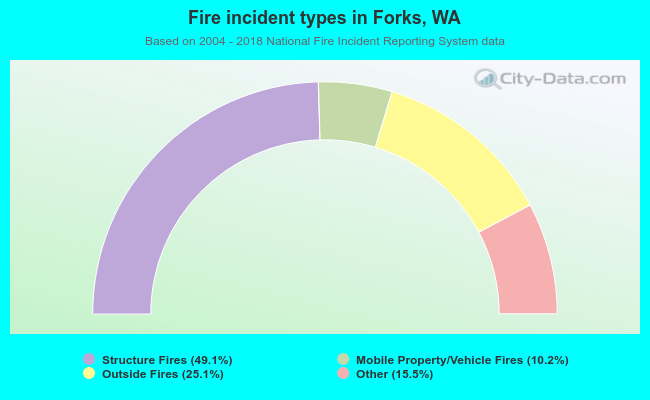 When looking into fire subcategories, the most incidents belonged to: Structure Fires (49.1%), and Outside Fires (25.1%).