Fort Bragg: Fire Incidents, California (CA)
Where are fire incidents reported in Fort Bragg, CA
Something went wrong! Please refresh the page.
|
| |||||||||||||||||||||||||||||||||||||||||||||||||||||||||||||||||||||||||||||||||||||||||||||||||||||||||||||
2005 - 2018 National Fire Incident Reporting System (NFIRS) incidents
- Incident types reported to NFIRS in Fort Bragg, CA
- 99326.5%Rescue & EMS
- 78721.0%Service Call
- 67418.0%Hazardous Condition
- 63016.8%Good Intent Call
- 40910.9%Fire
- 2556.8%False Alarm
- Fire incident types reported to NFIRS in Fort Bragg, CA
- 21251.8%Structure Fires
- 11828.9%Outside Fires
- 5012.2%Mobile Property/Vehicle Fires
- 297.1%Other
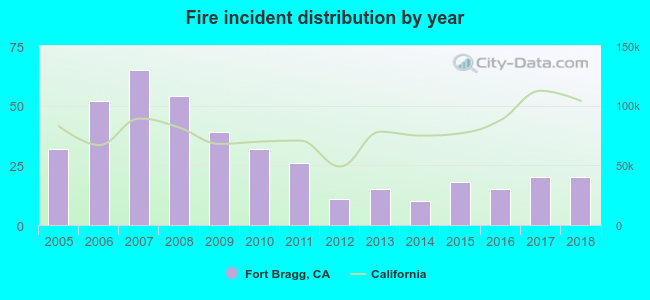 According to the data from the years 2005 - 2018 the average number of fire incidents per year is 29. The highest number of reported fire incidents - 65 took place in 2007, and the least - 10 in 2014. The data has a decreasing trend.
The average number of yearly fire incidents per 10k residents in Fort Bragg, CA compared to nearest cities:
(Note: Based on data for the last 3 years, including only cities with population 5,000 and above)
| Fort Bragg: | 25.1 |
| Ukiah: | 86.8 |
| Garberville: | 16.9 |
| Cloverdale: | 44.7 |
| Clearlake: | 61.0 |
| Healdsburg: | 46.6 |
| Hidden Valley Lake: | 3.6 |
| Fortuna: | 1.7 |
| Windsor: | 13.4 |

 35.2% incidents where reported in the morning and 64.8% in the evening. The most fires (15.9%) took place on Saturday, and the least (13.2%) on Monday.
 Based on the 409 reports from years 2005 - 2018 most fires (11.7%) took place during July, and the least (5.4%) in March.
 Out of all 3,750 cases reported during the years 2005 - 2018, the most belonged to the categories: Rescue & EMS (26.5%), Service Call (21.0%), and Hazardous Condition (18.0%).
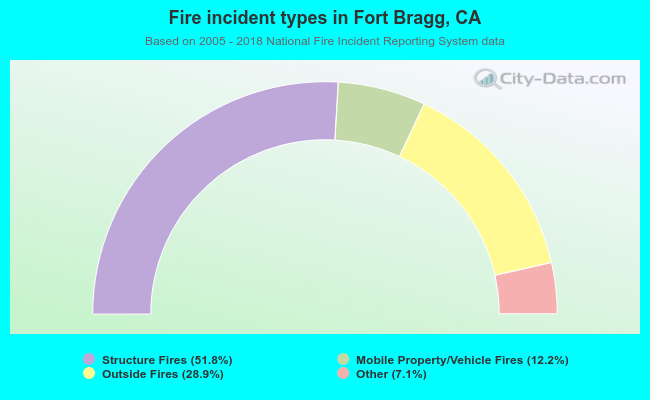 When looking into fire subcategories, the most incidents belonged to: Structure Fires (51.8%), and Outside Fires (28.9%).