Fortville: Fire Incidents, Indiana (IN)
Where are fire incidents reported in Fortville, IN
Something went wrong! Please refresh the page.
|
| |||||||||||||||||||||||||||||||||||||||||||||||||||||||||||||||||||||||||||||||||||||||||||||||||||||||||||||
2002 - 2018 National Fire Incident Reporting System (NFIRS) incidents
- Incident types reported to NFIRS in Fortville, IN
- 1,65162.8%Rescue & EMS
- 40715.5%Fire
- 2198.3%Good Intent Call
- 1315.0%False Alarm
- 1254.8%Hazardous Condition
- 843.2%Service Call
- 50.2%Overpressure Rupture
- 30.1%Severe Weather
- 30.1%Special Incident
- Fire incident types reported to NFIRS in Fortville, IN
- 16340.0%Outside Fires
- 15337.6%Structure Fires
- 5413.3%Mobile Property/Vehicle Fires
- 379.1%Other
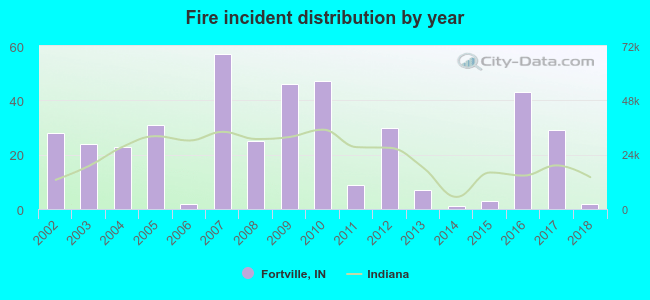 According to the data from the years 2002 - 2018 the average number of fires per year is 24. The highest number of fire incidents - 57 took place in 2007, and the least - 1 in 2014. The data has a dropping trend.
 26.5% incidents where reported in the morning and 73.5% in the evening. The most fires (17.9%) took place on Sunday, and the least (11.5%) on Monday.
 According to the 407 incident reports from years 2002 - 2018 most fires (12.0%) took place during March, and the least (3.4%) in December.
 Out of all 2,628 cases reported during the years 2002 - 2018, the most belonged to the categories: Rescue & EMS (62.8%), Fire (15.5%), and Good Intent Call (8.3%).
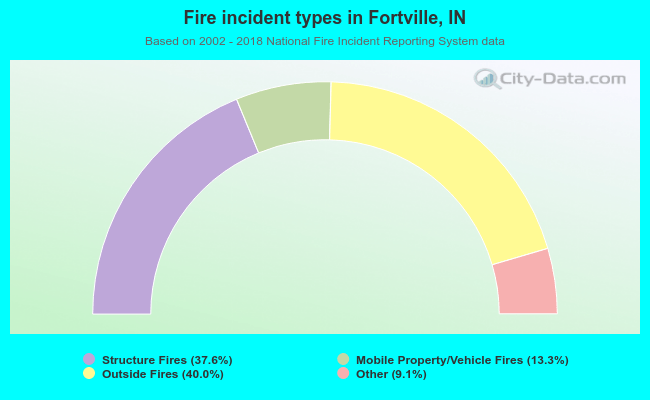 When looking into fire subcategories, the most reports belonged to: Outside Fires (40.0%), and Structure Fires (37.6%).