Fowler: Fire Incidents, Kansas (KS)
Where are fire incidents reported in Fowler, KS
Something went wrong! Please refresh the page.
|
| |||||||||||||||||||||||||||||||||||||||||||||||||||||||||||||||||||||||||||||||||||||||||||||||||||||||||||||
| Other | 40 | |||||||||||||||||||||||||||||||||||||||||||||||||||||||||||||||||||||||||||||||||||||||||||||||||||||||||||||
2002 - 2018 National Fire Incident Reporting System (NFIRS) incidents
- Incident types reported to NFIRS in Fowler, KS
- 18277.8%Fire
- 229.4%Rescue & EMS
- 114.7%Hazardous Condition
- 114.7%Good Intent Call
- 41.7%Special Incident
- 31.3%Service Call
- 10.4%Severe Weather
- Fire incident types reported to NFIRS in Fowler, KS
- 13674.7%Outside Fires
- 2212.1%Structure Fires
- 1910.4%Mobile Property/Vehicle Fires
- 52.7%Other
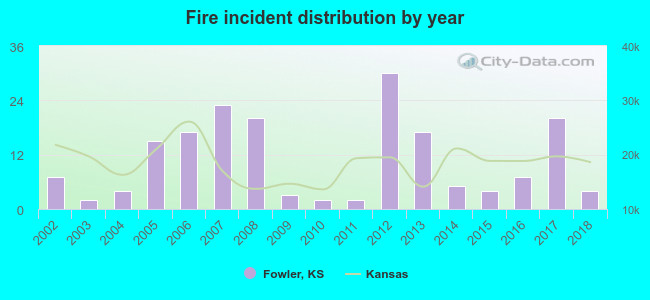 According to the data from the years 2002 - 2018 the average number of fires per year is 11. The highest number of reported fire incidents - 30 took place in 2012, and the least - 2 in 2003. The data has a dropping trend.
 18.7% incidents where reported in the morning and 81.3% in the evening. The most fires (17.6%) took place on Thursday, and the least (9.3%) on Sunday.
 Based on the 182 fires from years 2002 - 2018 most fires (14.8%) took place during June, and the least (2.2%) in December.
 Out of all 234 cases reported during the years 2002 - 2018, the most belonged to the categories: Fire (77.8%), Overpressure Rupture (9.4%), and Rescue & EMS (4.7%).
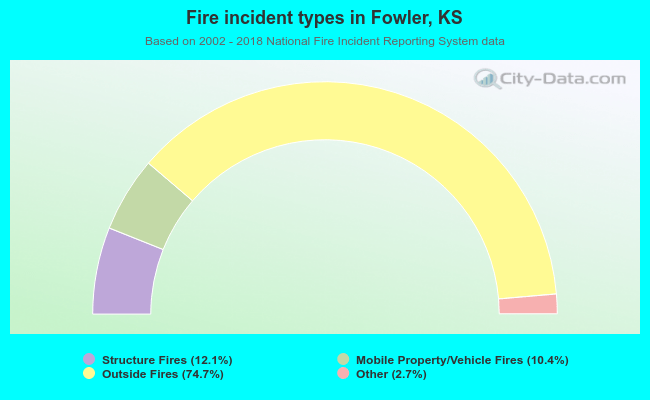 When looking into fire subcategories, the most incidents belonged to: Outside Fires (74.7%), and Structure Fires (12.1%).