Frankfort: Fire Incidents, Michigan (MI)
Where are fire incidents reported in Frankfort, MI
Something went wrong! Please refresh the page.
|
| |||||||||||||||||||||||||||||||||||||||||||||||||||||||||||||||||||||||||||||||||||||||||||||||||||||||||||||
| Other | 28 | |||||||||||||||||||||||||||||||||||||||||||||||||||||||||||||||||||||||||||||||||||||||||||||||||||||||||||||
2002 - 2018 National Fire Incident Reporting System (NFIRS) incidents
- Incident types reported to NFIRS in Frankfort, MI
- 50244.9%Hazardous Condition
- 23220.7%Fire
- 1079.6%Rescue & EMS
- 1049.3%Service Call
- 837.4%Good Intent Call
- 817.2%False Alarm
- 40.4%Severe Weather
- 40.4%Special Incident
- 20.2%Overpressure Rupture
- Fire incident types reported to NFIRS in Frankfort, MI
- 10043.1%Structure Fires
- 8335.8%Outside Fires
- 3715.9%Mobile Property/Vehicle Fires
- 125.2%Other
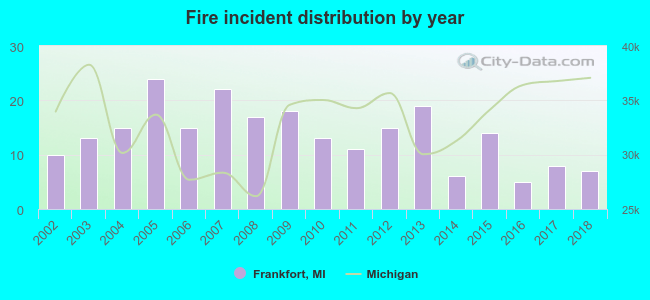 Based on the data from the years 2002 - 2018 the average number of fire incidents per year is 14. The highest number of reported fires - 24 took place in 2005, and the least - 5 in 2016. The data has a declining trend.
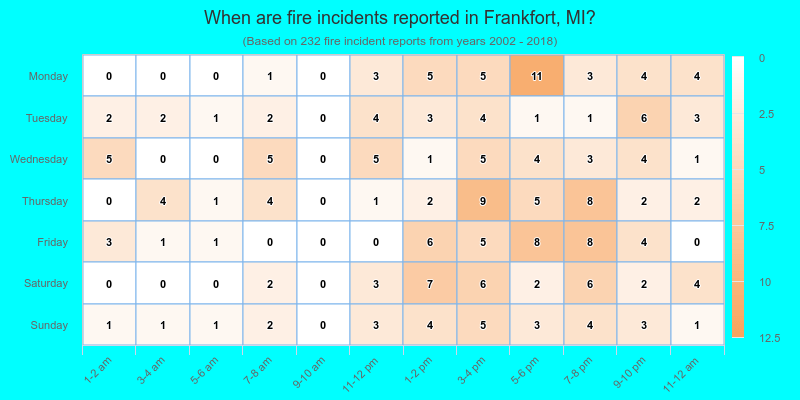
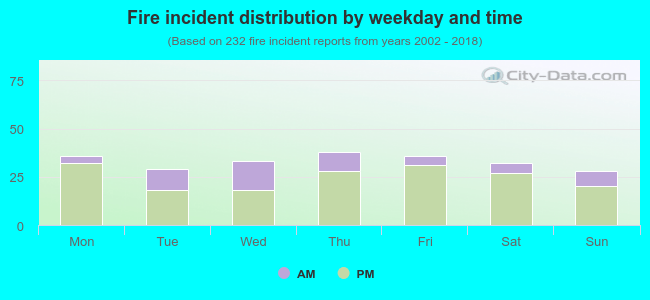 25.0% incidents where reported in the morning and 75.0% in the evening. The most fires (16.4%) took place on Thursday, and the least (12.1%) on Sunday.
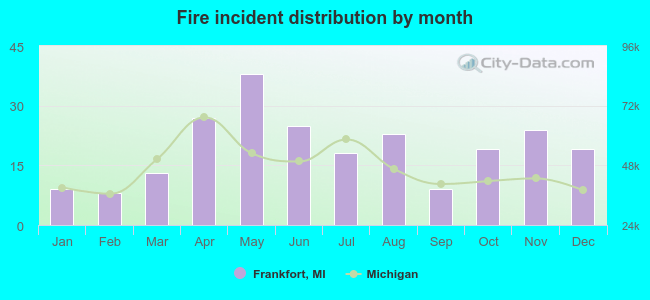 Based on the 232 reports from years 2002 - 2018 most fires (16.4%) took place during May, and the least (3.4%) in February.
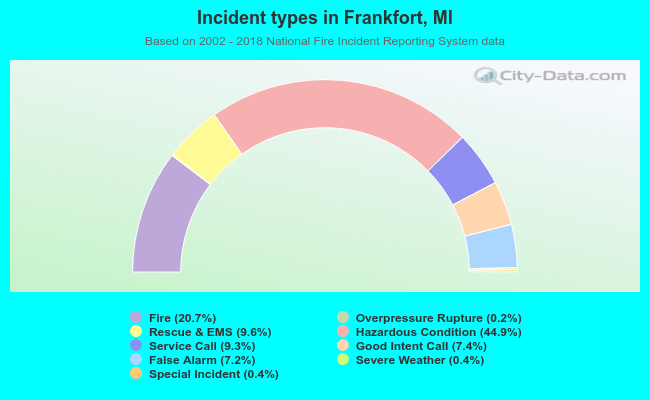 Out of all 1,119 cases reported during the years 2002 - 2018, the most belonged to the categories: Hazardous Condition (44.9%), Fire (20.7%), and Rescue & EMS (9.6%).
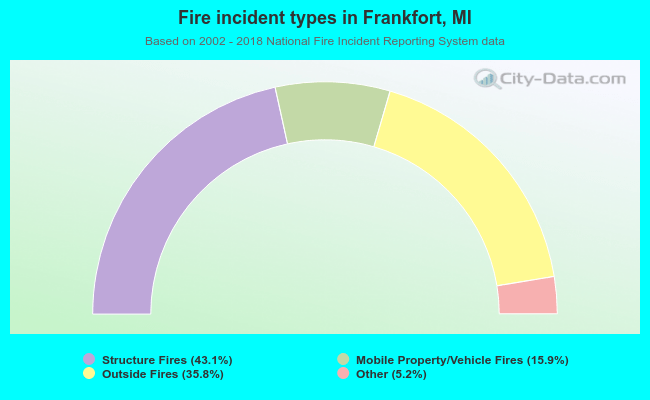 When looking into fire subcategories, the most incidents belonged to: Structure Fires (43.1%), and Outside Fires (35.8%).