Franklin: Fire Incidents, New Jersey (NJ)
Where are fire incidents reported in Franklin, NJ
Something went wrong! Please refresh the page.
|
| |||||||||||||||||||||||||||||||||||||||||||||||||||||||||||||||||||||||||||||||||||||||||||||||||||||||||||||
2005 - 2018 National Fire Incident Reporting System (NFIRS) incidents
- Incident types reported to NFIRS in Franklin, NJ
- 27531.4%Hazardous Condition
- 26029.7%Fire
- 20423.3%False Alarm
- 505.7%Service Call
- 485.5%Good Intent Call
- 343.9%Rescue & EMS
- 50.6%Special Incident
- Fire incident types reported to NFIRS in Franklin, NJ
- 12849.2%Structure Fires
- 7830.0%Outside Fires
- 2810.8%Mobile Property/Vehicle Fires
- 2610.0%Other
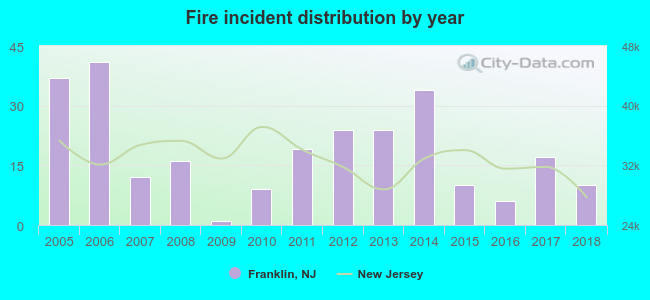 According to the data from the years 2005 - 2018 the average number of fire incidents per year is 19. The highest number of reported fire incidents - 41 took place in 2006, and the least - 1 in 2009. The data has a dropping trend.
 Based on the data from the years 2005 - 2018 the average number of fire-related casualties per year is 0. The highest number of injuries - 2 took place in 2006, and the lowest - 0 in 2007. The data has a declining trend.
 34.2% incidents where reported in the morning and 65.8% in the evening. The most fires (19.2%) took place on Monday, and the least (10.0%) on Sunday.
 According to the 260 incident reports from years 2005 - 2018 most fires (13.1%) took place during January, and the least (4.2%) in September.
 Out of all 876 cases reported during the years 2005 - 2018, the most belonged to the categories: Rescue & EMS (31.4%), Fire (29.7%), and Good Intent Call (23.3%).
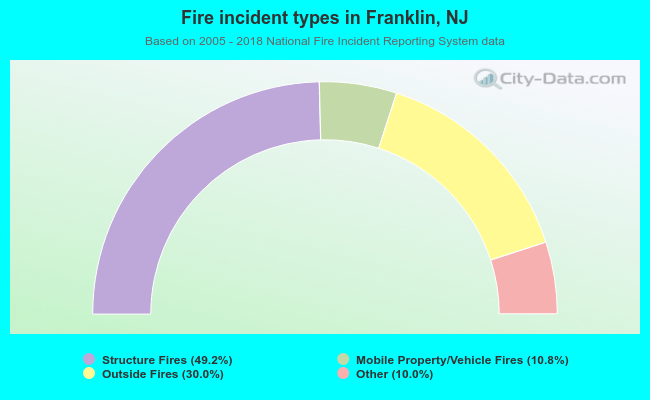 When looking into fire subcategories, the most reports belonged to: Structure Fires (49.2%), and Outside Fires (30.0%).