Franklinton: Fire Incidents, Louisiana (LA)
Where are fire incidents reported in Franklinton, LA
Something went wrong! Please refresh the page.
|
| |||||||||||||||||||||||||||||||||||||||||||||||||||||||||||||||||||||||||||||||||||||||||||||||||||||||||||||
| Other | 348 | |||||||||||||||||||||||||||||||||||||||||||||||||||||||||||||||||||||||||||||||||||||||||||||||||||||||||||||
2002 - 2018 National Fire Incident Reporting System (NFIRS) incidents
- Incident types reported to NFIRS in Franklinton, LA
- 2,62947.8%Rescue & EMS
- 1,76432.1%Fire
- 3686.7%Hazardous Condition
- 3296.0%Good Intent Call
- 2143.9%False Alarm
- 1673.0%Service Call
- 190.3%Severe Weather
- 60.1%Special Incident
- Fire incident types reported to NFIRS in Franklinton, LA
- 89450.7%Outside Fires
- 62435.4%Structure Fires
- 19310.9%Mobile Property/Vehicle Fires
- 533.0%Other
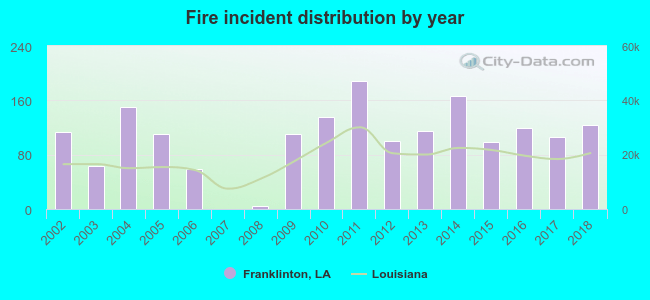 According to the data from the years 2002 - 2018 the average number of fire incidents per year is 104. The highest number of fires - 188 took place in 2011, and the least - 0 in 2007. The data has an increasing trend.
 The median response time based on all reported fire incidents is 7 minutes. This is close to the Louisiana median value.
The median response time in Franklinton, LA compared to nearest cities:
(Note: Based on data for all years, including only cities with at least 500 fire incidents)
| Franklinton: | 7 minutes |
| Folsom: | 7 minutes |
| Bogalusa: | 4 minutes |
| Kentwood: | 8 minutes |
| Independence: | 6 minutes |
| Covington: | 6 minutes |
| Tickfaw: | 6 minutes |
| Hammond: | 6 minutes |
| Madisonville: | 7 minutes |
 Based on the reports from the years 2002 - 2018 the average number of fire-related yearly deaths is 0. The highest number of deaths - 2 took place in 2016, and the lowest - 0 in 2004. The data has a declining trend.
 29.1% incidents where reported in the morning and 70.9% in the evening. The most fires (17.4%) took place on Saturday, and the least (12.9%) on Tuesday.
 Based on the 1,764 reports from years 2002 - 2018 most fires (14.9%) took place during January, and the least (3.8%) in August.
 Out of all 5,498 cases reported during the years 2002 - 2018, the most belonged to the categories: Rescue & EMS (47.8%), Fire (32.1%), and Hazardous Condition (6.7%).
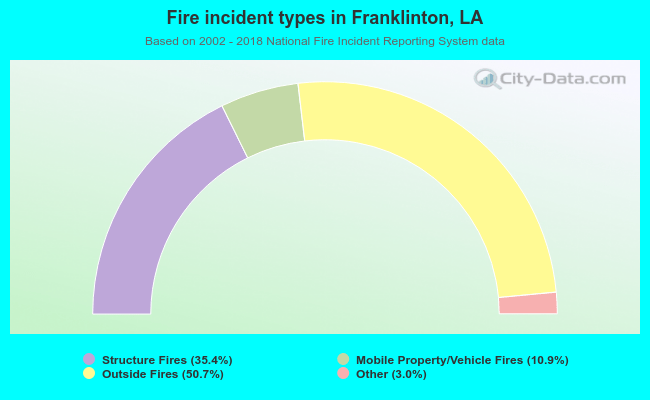 When looking into fire subcategories, the most reports belonged to: Outside Fires (50.7%), and Structure Fires (35.4%).