Freeland: Fire Incidents, Washington (WA)
Where are fire incidents reported in Freeland, WA
Something went wrong! Please refresh the page.
|
| |||||||||||||||||||||||||||||||||||||||||||||||||||||||||||||||||||||||||||||||||||||||||||||||||||||||||||||
2003 - 2018 National Fire Incident Reporting System (NFIRS) incidents
- Incident types reported to NFIRS in Freeland, WA
- 2,22463.4%Rescue & EMS
- 3259.3%Fire
- 2928.3%Service Call
- 2627.5%Hazardous Condition
- 1835.2%Good Intent Call
- 1494.2%False Alarm
- 591.7%Severe Weather
- 150.4%Special Incident
- Fire incident types reported to NFIRS in Freeland, WA
- 14644.9%Outside Fires
- 12237.5%Structure Fires
- 4413.5%Mobile Property/Vehicle Fires
- 134.0%Other
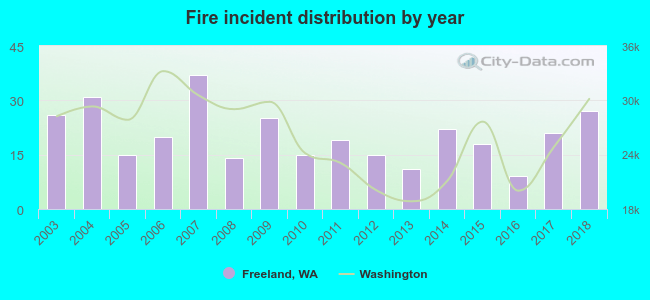 Based on the data from the years 2003 - 2018 the average number of fires per year is 20. The highest number of reported fires - 37 took place in 2007, and the least - 9 in 2016. The data has an increasing trend.
 35.7% incidents where reported in the morning and 64.3% in the evening. The most fires (16.9%) took place on Thursday, and the least (11.4%) on Wednesday.
 Based on the 325 fire incident reports from years 2003 - 2018 most fires (20.6%) took place during July, and the least (3.4%) in March.
 Out of all 3,510 cases reported during the years 2003 - 2018, the most belonged to the categories: Rescue & EMS (63.4%), Fire (9.3%), and Service Call (8.3%).
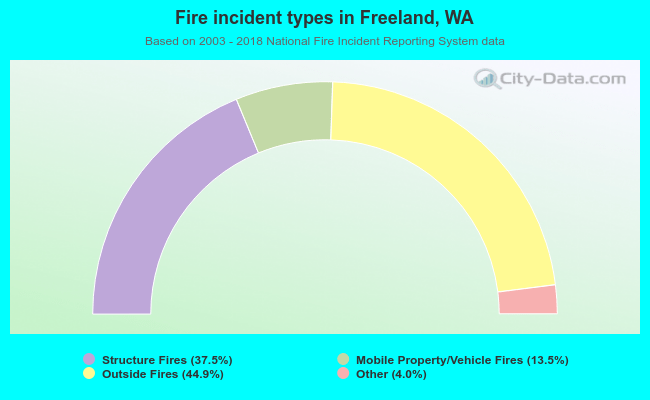 When looking into fire subcategories, the most incidents belonged to: Outside Fires (44.9%), and Structure Fires (37.5%).