| Fire incidents reported |
|---|
| Sreet name | Count |
|---|
| MCKNIGHT LOOP | 14 | | OLD BROWNSVILLE | 12 | | HWY 70 | 8 | | PIN OAK CV | 8 | | WATSON DR | 8 | | WATSON DRIVE | 8 | | BURROW CEMETARY | 6 | | CENTERPOINT | 6 | | CENTERPOINT DR | 6 | | HIGHWAY 70 HWY | 6 | | HWY 196 | 6 | | HWY.70 HWY | 6 | | MCKNIGHT LOOP | 6 | | OLD BROWNSVILLE RD | 6 | | BATTLE CV | 4 | | BURROW CEMETERY DR | 4 | | HICKORY WITHE RD | 4 | | HIGHWAY 70 | 4 | | LAYTON CEMETERY CV | 4 | | OLD BROWNSVILLE RD. | 4 | | 413 MAIN STREET | 2 | | 20 BLK POPLAR SPRINGS LOOP | 2 | | 219 JACKSON ST | 2 | | 329 MAIN ST | 2 | | 405 BURROW CEMETERY ROAD | 2 |
| | | Fire incidents reported |
|---|
| Sreet name | Count |
|---|
| 500 COX ROAD | 2 | | BATTLE COVE | 2 | | BLK HWY 70 | 2 | | BURROW CEMETARY DR | 2 | | BURROW CEMETARY DR | 2 | | BURROW CEMETARY ROAD | 2 | | BURROWNTOWN ROAD | 2 | | BURROWTOWN | 2 | | BURROWTOWN DR | 2 | | BURROWTOWN RD | 2 | | BURROWTOWN RD | 2 | | BURROWTOWN ROAD | 2 | | CENTEPOINT | 2 | | CENTER POINT DR. | 2 | | CENTER POINT RD | 2 | | CENTER POINT ROAD | 2 | | CENTERPOINT DR | 2 | | DRIVERS RD | 2 | | GALLAWAY SEWER LAGOONS | 2 | | HARRELL DR | 2 | | HICKORY WITHE ROAD | 2 | | HWY 70 OLD BROWNSVILLE | 2 | | HWY. 70 | 2 | | HWY.196 | 2 | | |
|
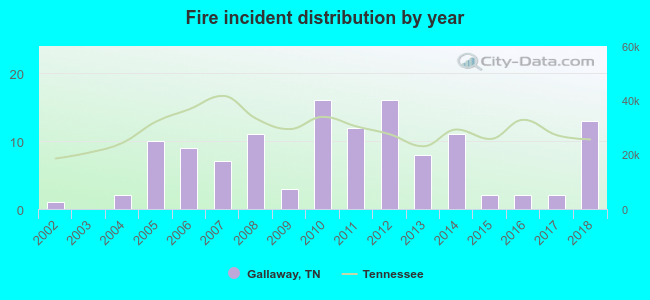 According to the data from the years 2002 - 2018 the average number of fire incidents per year is 7. The highest number of fire incidents - 16 took place in 2010, and the least - 0 in 2003. The data has a growing trend.
 26.4% incidents where reported in the morning and 73.6% in the evening. The most fires (23.2%) took place on Saturday, and the least (8.8%) on Wednesday.
 Based on the 125 fires from years 2002 - 2018 most fires (14.4%) took place during July, and the least (4.0%) in June.
 Out of all 355 cases reported during the years 2002 - 2018, the most belonged to the categories: Fire (35.2%), Overpressure Rupture (33.2%), and Service Call (9.0%).
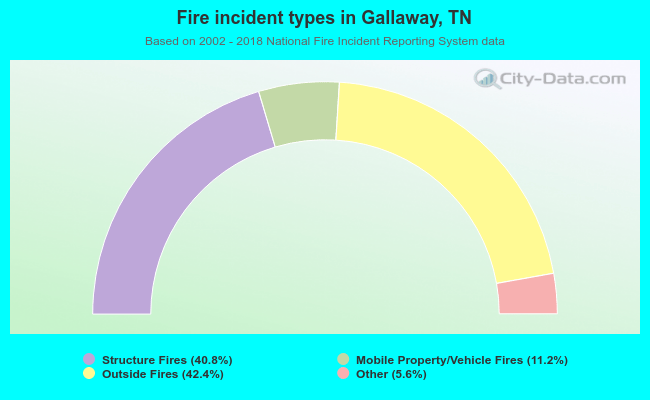 When looking into fire subcategories, the most incidents belonged to: Outside Fires (42.4%), and Structure Fires (40.8%).