Georgetown: Fire Incidents, Texas (TX)
Where are fire incidents reported in Georgetown, TX
Something went wrong! Please refresh the page.
| Fire incidents reported | |
|---|---|
| Sreet name | Count |
| IH 35 . | 416 |
| IH 35 FWY | 264 |
| UNIVERSITY AVE | 208 |
| AUSTIN AVE | 204 |
| IH 35 | 192 |
| WILLIAMS DR | 172 |
| LEANDER RD | 98 |
| SH 130 | 82 |
| SH 29 | 80 |
| JACOBS WAY | 66 |
| INNER LOOP | 58 |
| FM 1460 | 54 |
| FM 971 | 50 |
| LUTHER DR | 48 |
| SH 195 | 46 |
| QUAIL VALLEY DR | 42 |
| NORTHWEST BLVD | 40 |
| STATE HIGHWAY 29 HWY | 40 |
| MAPLE ST | 38 |
| MORROW ST | 36 |
| 22ND ST | 34 |
| SHELL RD | 34 |
| 8TH ST | 32 |
| AIRPORT RD | 32 |
| CR 152 | 32 |
| RIVERY BLVD | 32 |
| STATE HWY 29 . | 32 |
| RIVER BEND DR | 28 |
| CEDAR HOLLOW RD | 26 |
| COLLEGE ST | 26 |
| Other | 720 |
2002 - 2018 National Fire Incident Reporting System (NFIRS) incidents
- Incident types reported to NFIRS in Georgetown, TX
- 28,73558.3%Rescue & EMS
- 5,47211.1%Hazardous Condition
- 4,6019.3%Service Call
- 4,5219.2%Good Intent Call
- 3,2626.6%Fire
- 2,6365.3%False Alarm
- Fire incident types reported to NFIRS in Georgetown, TX
- 1,90558.4%Outside Fires
- 80724.7%Structure Fires
- 51115.7%Mobile Property/Vehicle Fires
- 391.2%Other
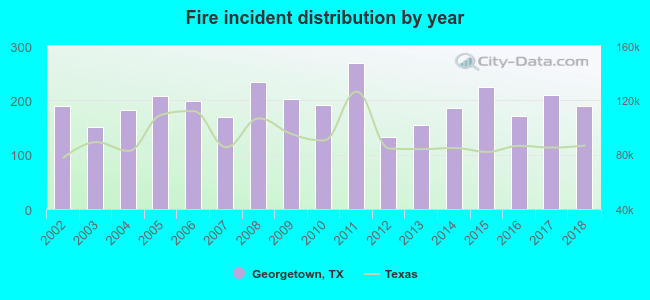 Based on the data from the years 2002 - 2018 the average number of fires per year is 192. The highest number of fire incidents - 268 took place in 2011, and the least - 132 in 2012. The data has a constant trend.
The average number of yearly fire incidents per 10k residents in Georgetown, TX compared to nearest cities:
(Note: Based on data for the last 3 years, including only cities with population 5,000 and above)
| Georgetown: | 32.1 |
| Jarrell: | 52.8 |
| Round Rock: | 17.3 |
| Hutto: | 42.8 |
| Leander: | 38.0 |
| Cedar Park: | 18.8 |
| Jollyville: | 0.6 |
| Pflugerville: | 20.1 |
| Taylor: | 46.1 |
 The median response time based on all reported fire incidents is 7 minutes. This is similar to the state median value.
The median response time in Georgetown, TX compared to nearest cities:
(Note: Based on data for all years, including only cities with at least 500 fire incidents)
| Georgetown: | 7 minutes |
| Jarrell: | 7 minutes |
| Round Rock: | 5 minutes |
| Hutto: | 8 minutes |
| Leander: | 7 minutes |
| Cedar Park: | 6 minutes |
| Liberty Hill: | 10 minutes |
| Pflugerville: | 7 minutes |
| Florence: | 10 minutes |
 According to the reports from the years 2002 - 2018 the average number of fire-related yearly deaths is 0. The highest number of reported deaths - 2 took place in 2006, and the lowest - 0 in 2002. The data has a constant trend.
The average number of deaths per 1,000 fires is 1. This indicator was the highest - 10 in 2006, and the lowest 0 in 2002. The trend for fatalities per 1,000 incidents is constant. Compared to the Texas value the number of deaths per 1,000 fires is lower.
According to the reports from the years 2002 - 2018 the average number of fire-related yearly deaths is 0. The highest number of reported deaths - 2 took place in 2006, and the lowest - 0 in 2002. The data has a constant trend.
The average number of deaths per 1,000 fires is 1. This indicator was the highest - 10 in 2006, and the lowest 0 in 2002. The trend for fatalities per 1,000 incidents is constant. Compared to the Texas value the number of deaths per 1,000 fires is lower.Deaths per 1,000 incidents in Georgetown, TX compared to nearest cities:
(Note: Based on data for all years, including only cities with at least 2,500 fire incidents)
| Georgetown: | 1.2 |
| Round Rock: | 0.7 |
| Austin: | 1.8 |
| Killeen: | 1.8 |
| Copperas Cove: | 1.1 |
| Temple: | 2.9 |
 Based on the data from the years 2002 - 2018 the average number of fire-related yearly casualties is 2. The highest number of reported injuries - 11 took place in 2002, and the lowest - 0 in 2004. The data has a dropping trend.
The average number of injuries per 1,000 fires is 10. This indicator was the highest - 58 in 2002, and the lowest 0 in 2004. The trend for injuries per 1,000 incidents is decreasing. Compared to the Texas value the number of casualties per 1,000 incidents is higher.
Based on the data from the years 2002 - 2018 the average number of fire-related yearly casualties is 2. The highest number of reported injuries - 11 took place in 2002, and the lowest - 0 in 2004. The data has a dropping trend.
The average number of injuries per 1,000 fires is 10. This indicator was the highest - 58 in 2002, and the lowest 0 in 2004. The trend for injuries per 1,000 incidents is decreasing. Compared to the Texas value the number of casualties per 1,000 incidents is higher.Casualties per 1,000 incidents in Georgetown, TX compared to nearest cities:
(Note: Based on data for all years, including only cities with at least 500 fire incidents)
| Georgetown: | 10.4 |
| Jarrell: | 3.6 |
| Round Rock: | 8.6 |
| Hutto: | 3.5 |
| Leander: | 4.2 |
| Cedar Park: | 5.9 |
| Liberty Hill: | 0.0 |
| Pflugerville: | 2.1 |
| Florence: | 7.4 |
 26.0% incidents where reported in the morning and 74.0% in the evening. The most fires (15.1%) took place on Monday, and the least (13.4%) on Thursday.
 According to the 3,262 fires from years 2002 - 2018 most fires (11.5%) took place during July, and the least (5.9%) in November.
 Out of all 49,314 cases reported during the years 2002 - 2018, the most belonged to the categories: Rescue & EMS (58.3%), Hazardous Condition (11.1%), and Service Call (9.3%).
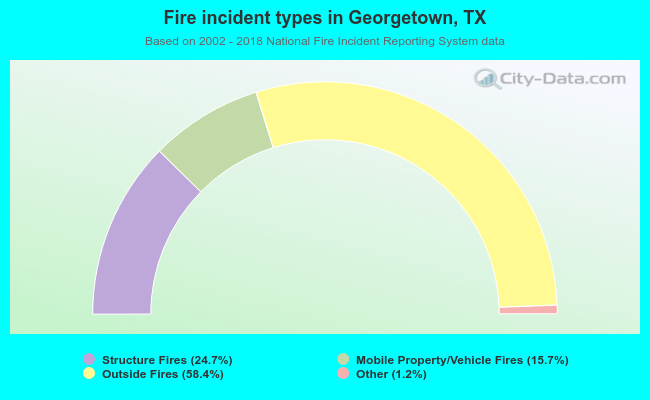 When looking into fire subcategories, the most incidents belonged to: Outside Fires (58.4%), and Structure Fires (24.7%).