| Fire incidents reported |
|---|
| Sreet name | Count |
|---|
| LAKEVIEW DR | 72 | | CLEMENTON RD | 56 | | BERLIN RD | 18 | | HOLLY RD | 18 | | UNITED STATES AVE | 18 | | HADDON | 16 | | FOSTER AVE | 14 | | HADDONFIELD BERLIN RD | 12 | | JOHNSON RD | 12 | | WINDING WAY | 12 | | HADDON AVE | 10 | | UNITED STATES | 10 | | WINDING | 10 | | KIRKWOOD RD | 8 | | DEMOCRAT WAY | 6 | | EASTWICK DR | 6 | | FARWOOD RD | 6 | | FOSTER | 6 | | NORCROSS RD | 6 | | CLEARBROOK DR | 4 | | DEMOCRAT | 4 | | EDGEHILL RD | 4 | | HADDONFIELD-BERLIN RD | 4 | | HOLLY AVE | 4 | | KRESSON MILFORD RD | 4 |
| | | Fire incidents reported |
|---|
| Sreet name | Count |
|---|
| LAKE VIEW DR | 4 | | MCKEE RD | 4 | | OLD EGG HARBOR RD | 4 | | BIRCHWOOD | 2 | | BRADFORD WAY | 2 | | CEDARCROFT RD | 2 | | CENTENNIAL BLVD | 2 | | CHATHAM RD | 2 | | CLEARBROOK | 2 | | CLEMENTON | 2 | | EAST RD | 2 | | EDGEWOOD RD | 2 | | FARWOOD DR | 2 | | FOSTER & CLEMENTON | 2 | | GIBBSBORO FIRE HALL | 2 | | GIBBSBORO KIRKWOOD RD | 2 | | GLENVIEW | 2 | | HADDON AV | 2 | | HADDONFIELDBERLIN RD | 2 | | HAWTHORNE RD | 2 | | HOLLY RDS | 2 | | JOHNSON RD | 2 | | KIRKWOOD RD | 2 | | KRESSON GIBBSBORO RD | 2 | | |
|
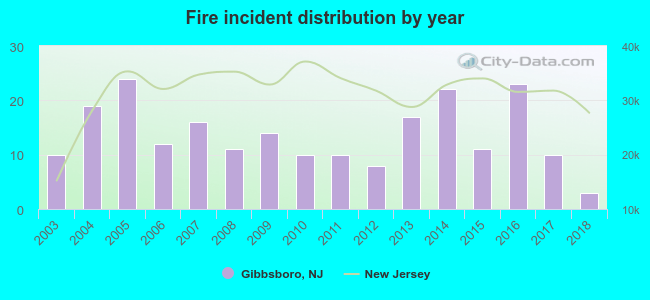 According to the data from the years 2003 - 2018 the average number of fires per year is 14. The highest number of fire incidents - 24 took place in 2005, and the least - 3 in 2018. The data has a declining trend.
 28.2% incidents where reported in the morning and 71.8% in the evening. The most fires (18.2%) took place on Thursday, and the least (11.4%) on Tuesday.
 Based on the 220 fires from years 2003 - 2018 most fires (15.9%) took place during April, and the least (4.1%) in August.
 Out of all 1,533 cases reported during the years 2003 - 2018, the most belonged to the categories: Hazardous Condition (40.1%), Rescue & EMS (22.8%), and Fire (14.4%).
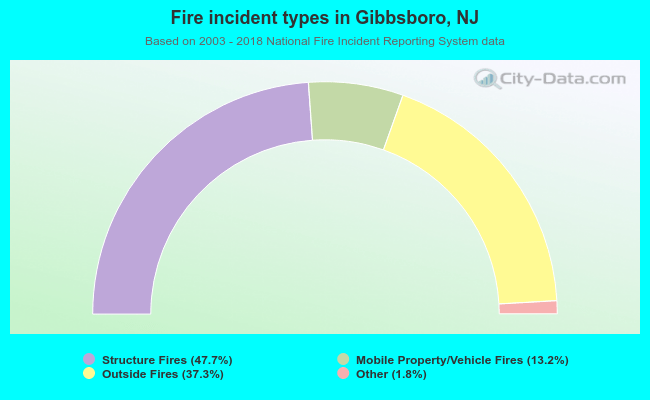 When looking into fire subcategories, the most incidents belonged to: Structure Fires (47.7%), and Outside Fires (37.3%).