Gillsville: Fire Incidents, Georgia (GA)
Where are fire incidents reported in Gillsville, GA
Something went wrong! Please refresh the page.
|
| |||||||||||||||||||||||||||||||||||||||||||||||||||||||||||||||||||||||||||||||||||||||||||||||||||||||||||||
2003 - 2018 National Fire Incident Reporting System (NFIRS) incidents
- Incident types reported to NFIRS in Gillsville, GA
- 98063.2%Rescue & EMS
- 19212.4%Fire
- 15710.1%Service Call
- 1258.1%Good Intent Call
- 764.9%Hazardous Condition
- 201.3%False Alarm
- Fire incident types reported to NFIRS in Gillsville, GA
- 9449.0%Outside Fires
- 6332.8%Structure Fires
- 3417.7%Mobile Property/Vehicle Fires
- 10.5%Other
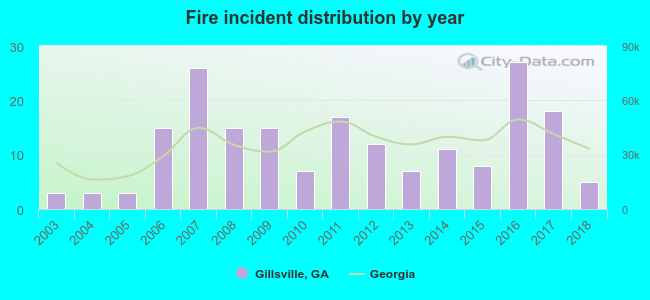 According to the data from the years 2003 - 2018 the average number of fires per year is 12. The highest number of reported fires - 27 took place in 2016, and the least - 3 in 2003. The data has a rising trend.
 According to the reports from the years 2003 - 2018 the average number of fire-related yearly casualties is 0. The highest number of reported injuries - 1 took place in 2006, and the lowest - 0 in 2003. The data has a constant trend.
 31.8% incidents where reported in the morning and 68.2% in the evening. The most fires (18.8%) took place on Saturday, and the least (9.9%) on Tuesday.
 Based on the 192 reports from years 2003 - 2018 most fires (16.7%) took place during March, and the least (5.2%) in July.
 Out of all 1,551 cases reported during the years 2003 - 2018, the most belonged to the categories: Overpressure Rupture (63.2%), Fire (12.4%), and Hazardous Condition (10.1%).
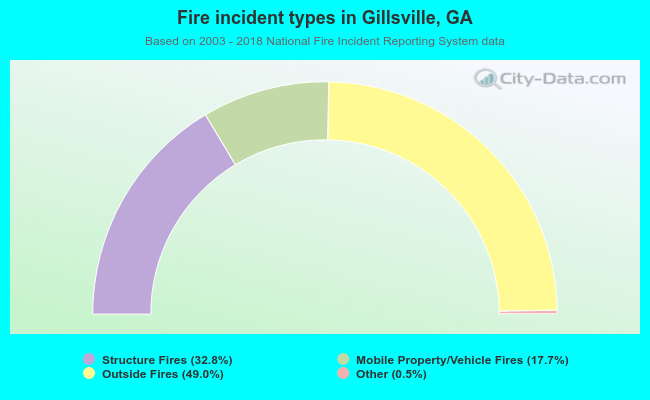 When looking into fire subcategories, the most reports belonged to: Outside Fires (49.0%), and Structure Fires (32.8%).