Glens Falls: Fire Incidents, New York (NY)
Where are fire incidents reported in Glens Falls, NY
Something went wrong! Please refresh the page.
| Fire incidents reported | |
|---|---|
| Sreet name | Count |
| GLEN ST | 234 |
| RIDGE ST | 120 |
| WARREN ST | 114 |
| PARK ST | 86 |
| SOUTH ST | 76 |
| BAY ST | 72 |
| MAPLE ST | 66 |
| BROAD ST | 64 |
| ELM ST | 46 |
| SHERMAN AVE | 34 |
| LAWRENCE ST | 32 |
| COOPER ST | 28 |
| HENRY HUDSON TOWNHOUSES | 28 |
| MONTCALM ST | 28 |
| DIX AVE | 24 |
| HUNTER ST | 24 |
| ROGER ST | 24 |
| JAY ST | 22 |
| PLATT ST | 20 |
| SANFORD ST | 20 |
| SECOND ST | 20 |
| BUSH ST | 18 |
| CHESTER ST | 18 |
| HARRISON AVE | 18 |
| CHERRY ST | 16 |
| CRANDALL ST | 16 |
| DIVISION ST | 16 |
| FIRST ST | 16 |
| HASKELL AVE | 16 |
| HUDSON AVE | 16 |
2002 - 2018 National Fire Incident Reporting System (NFIRS) incidents
- Incident types reported to NFIRS in Glens Falls, NY
- 9,81263.1%Rescue & EMS
- 1,5399.9%Hazardous Condition
- 1,2598.1%Service Call
- 1,2207.9%False Alarm
- 1,0586.8%Fire
- 6023.9%Good Intent Call
- 330.2%Severe Weather
- 160.1%Overpressure Rupture
- Fire incident types reported to NFIRS in Glens Falls, NY
- 66562.9%Structure Fires
- 25023.6%Outside Fires
- 12311.6%Mobile Property/Vehicle Fires
- 201.9%Other
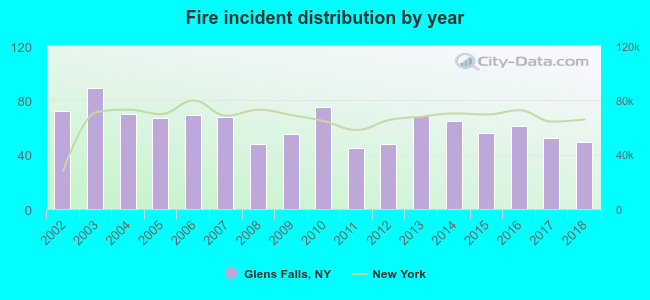 According to the data from the years 2002 - 2018 the average number of fires per year is 62. The highest number of fires - 89 took place in 2003, and the least - 45 in 2011. The data has a dropping trend.
The average number of yearly fire incidents per 10k residents in Glens Falls, NY compared to nearest cities:
(Note: Based on data for the last 3 years, including only cities with population 5,000 and above)
| Glens Falls: | 37.4 |
| Queensbury: | 42.2 |
| Moreau: | 11.1 |
| Hudson Falls: | 56.3 |
| Kingsbury: | 6.1 |
| Northumberland: | 2.0 |
| Wilton: | 11.3 |
| Greenfield: | 14.8 |
| Saratoga Springs: | 38.1 |
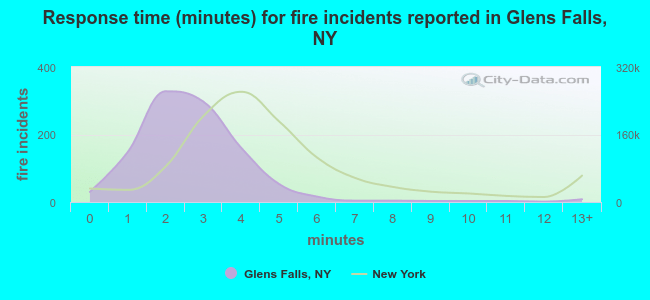 The median response time based on all reported fire incidents is 3 minutes. This is lower compared to the New York median value.
The median response time in Glens Falls, NY compared to nearest cities:
(Note: Based on data for all years, including only cities with at least 500 fire incidents)
| Glens Falls: | 3 minutes |
| Queensbury: | 5 minutes |
| Hudson Falls: | 7 minutes |
| Lake George: | 7 minutes |
| Saratoga Springs: | 5 minutes |
| Mechanicville: | 5 minutes |
| Clifton Park: | 6 minutes |
| Halfmoon: | 6 minutes |
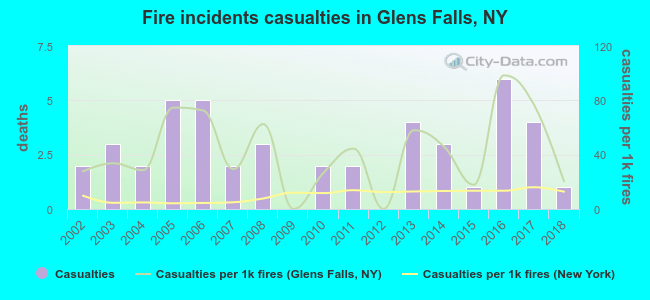 According to the reports from the years 2002 - 2018 the average number of fire-related yearly casualties is 3. The highest number of reported injuries - 6 took place in 2016, and the lowest - 0 in 2009. The data has a decreasing trend.
The average number of casualties per 1,000 fire incidents is 42. This indicator was the highest - 98 in 2016, and the lowest 0 in 2009. The trend for casualties per 1,000 fires is dropping. Compared to the state value the number of injuries per 1,000 fire incidents is much higher.
According to the reports from the years 2002 - 2018 the average number of fire-related yearly casualties is 3. The highest number of reported injuries - 6 took place in 2016, and the lowest - 0 in 2009. The data has a decreasing trend.
The average number of casualties per 1,000 fire incidents is 42. This indicator was the highest - 98 in 2016, and the lowest 0 in 2009. The trend for casualties per 1,000 fires is dropping. Compared to the state value the number of injuries per 1,000 fire incidents is much higher.Casualties per 1,000 incidents in Glens Falls, NY compared to nearest cities:
(Note: Based on data for all years, including only cities with at least 500 fire incidents)
| Glens Falls: | 42.5 |
| Queensbury: | 4.1 |
| Hudson Falls: | 6.7 |
| Lake George: | 4.7 |
| Saratoga Springs: | 13.0 |
| Mechanicville: | 9.4 |
| Clifton Park: | 6.7 |
| Halfmoon: | 6.8 |
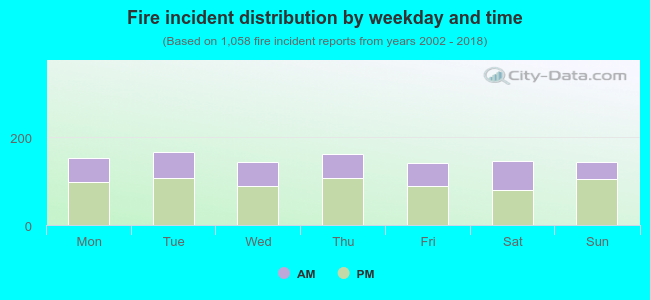 36.6% incidents where reported in the morning and 63.4% in the evening. The most fires (15.8%) took place on Tuesday, and the least (13.4%) on Friday.
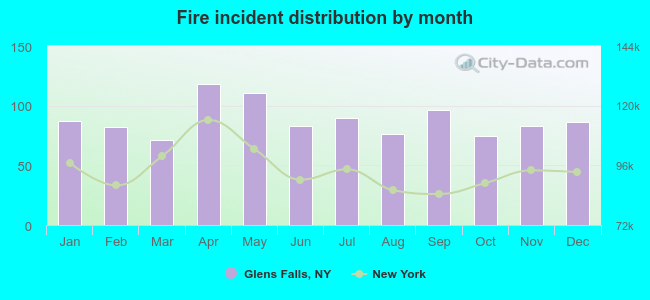 According to the 1,058 fire incidents from years 2002 - 2018 most fires (11.2%) took place during April, and the least (6.7%) in March.
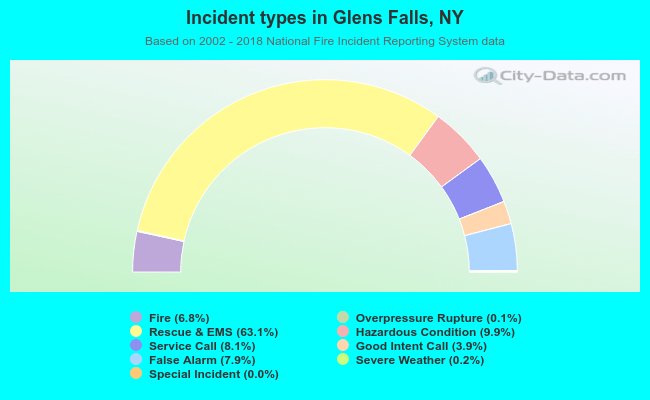 Out of all 15,541 cases reported during the years 2002 - 2018, the most belonged to the categories: Rescue & EMS (63.1%), Hazardous Condition (9.9%), and Service Call (8.1%).
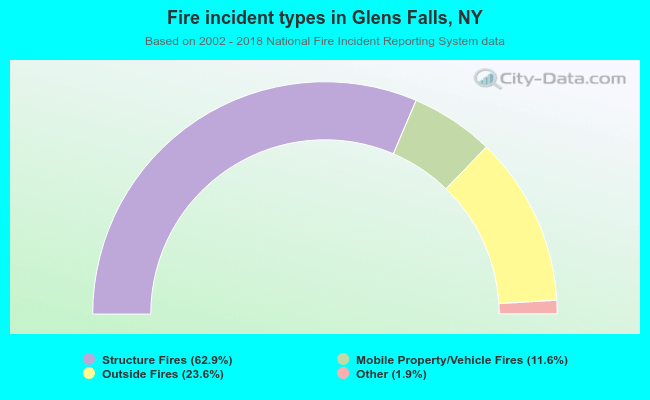 When looking into fire subcategories, the most incidents belonged to: Structure Fires (62.9%), and Outside Fires (23.6%).