| Fire incidents reported |
|---|
| Sreet name | Count |
|---|
| HWY 84 | 36 | | HWY 8 | 32 | | HWY 70 | 22 | | HWY 70 WEST | 16 | | BAKER RD | 12 | | HWY 70 EAST | 10 | | BUCK RD | 8 | | BAKER | 6 | | BROADWAY | 6 | | HIGHWAY 70 HWY | 6 | | HWY 70 LOOP | 6 | | HWY 8 N | 6 | | KENNEDY CUT OFF | 6 | | MTN VIEW | 6 | | ROCK CREEK CUT OFF | 6 | | ROCK CREEK RD | 6 | | SPUR LN | 6 | | BUMBLEBEE RD | 4 | | COUNTY LINE ROAD | 4 | | FRANK WILSON RD | 4 | | FRANK WILSON ROAD | 4 | | FRAZIER COWART RD | 4 | | GILMER | 4 | | GRANT FARM RD | 4 | | HWY 70 70B | 4 |
| | | Fire incidents reported |
|---|
| Sreet name | Count |
|---|
| HWY 70 W | 4 | | HWY 8 E | 4 | | HWY 8 EAST | 4 | | HWY 8 S | 4 | | INDUSTRIAL PARK RD | 4 | | KENNEDY RD | 4 | | MT VIEW RD | 4 | | MTN VIEW RD | 4 | | PUMP STATION RD | 4 | | ROCK CREEK ROAD | 4 | | ROCKCREEK RD | 4 | | SWEETGUM LN | 4 | | VAUGHN ROAD | 4 | | WALNUT RD | 4 | | #### HOBB ADAMS RD. | 2 | | #3 HAYS STREET | 2 | | 100 CHRIS RD | 2 | | 100 TIDWELL | 2 | | 1000 BLOCK OF N CLAY ST | 2 | | 1026 MTN VIEW RD | 2 | | 1039 KENNEDY RD | 2 | | 104 SWEET GUM LANE | 2 | | 1084 HWY 8 EAST | 2 | | 1097 ROCKY PINES RD | 2 | | |
|
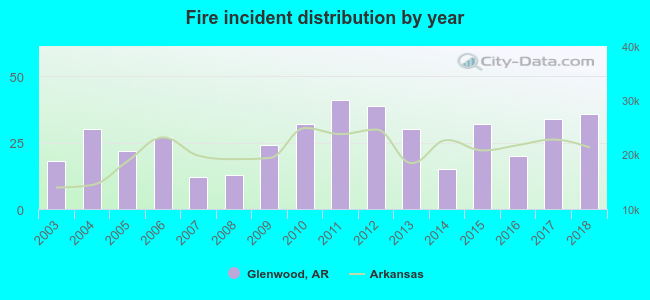 According to the data from the years 2003 - 2018 the average number of fires per year is 27. The highest number of fires - 41 took place in 2011, and the least - 12 in 2007. The data has an increasing trend.
 27.5% incidents where reported in the morning and 72.5% in the evening. The most fires (16.4%) took place on Sunday, and the least (12.0%) on Wednesday.
 According to the 426 reports from years 2003 - 2018 most fires (12.0%) took place during January, and the least (5.6%) in September.
 Out of all 785 cases reported during the years 2003 - 2018, the most belonged to the categories: Fire (54.3%), Rescue & EMS (30.7%), and Hazardous Condition (4.8%).
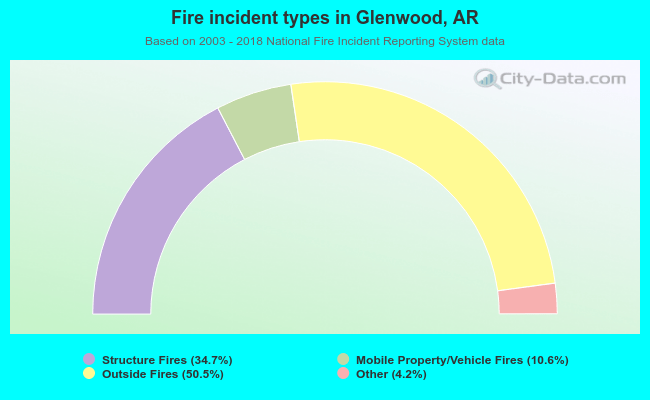 When looking into fire subcategories, the most incidents belonged to: Outside Fires (50.5%), and Structure Fires (34.7%).