Glenwood: Fire Incidents, Iowa (IA)
Where are fire incidents reported in Glenwood, IA
Something went wrong! Please refresh the page.
|
| |||||||||||||||||||||||||||||||||||||||||||||||||||||||||||||||||||||||||||||||||||||||||||||||||||||||||||||
2002 - 2018 National Fire Incident Reporting System (NFIRS) incidents
- Incident types reported to NFIRS in Glenwood, IA
- 40035.2%Rescue & EMS
- 27824.5%Fire
- 17815.7%Good Intent Call
- 16814.8%Hazardous Condition
- 554.8%False Alarm
- 423.7%Service Call
- 111.0%Special Incident
- 20.2%Overpressure Rupture
- 20.2%Severe Weather
- Fire incident types reported to NFIRS in Glenwood, IA
- 15154.3%Outside Fires
- 7426.6%Structure Fires
- 3914.0%Mobile Property/Vehicle Fires
- 145.0%Other
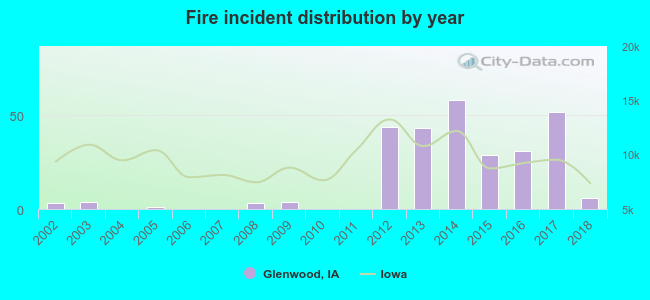 According to the data from the years 2002 - 2018 the average number of fires per year is 16. The highest number of reported fires - 58 took place in 2014, and the least - 0 in 2004. The data has an increasing trend.
The average number of yearly fire incidents per 10k residents in Glenwood, IA compared to nearest cities:
(Note: Based on data for the last 3 years, including only cities with population 5,000 and above)
| Glenwood: | 56.6 |
| Council Bluffs: | 37.4 |
| Red Oak: | 15.6 |
| Shenandoah: | 74.2 |

 24.1% incidents where reported in the morning and 75.9% in the evening. The most fires (19.8%) took place on Saturday, and the least (9.4%) on Monday.
 According to the 278 fire incidents from years 2002 - 2018 most fires (15.1%) took place during March, and the least (4.3%) in August.
 Out of all 1,136 cases reported during the years 2002 - 2018, the most belonged to the categories: Rescue & EMS (35.2%), Fire (24.5%), and Good Intent Call (15.7%).
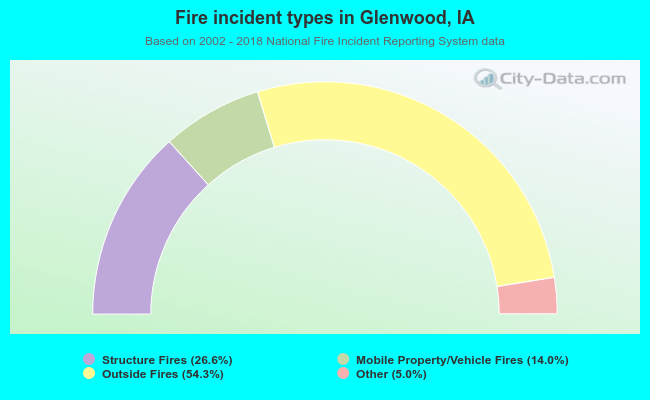 When looking into fire subcategories, the most incidents belonged to: Outside Fires (54.3%), and Structure Fires (26.6%).