| Fire incidents reported |
|---|
| Sreet name | Count |
|---|
| BAY CITY BLACKTOP | 8 | | FRANKLIN ST | 8 | | HIGHWAY 146 | 6 | | HWY 145 | 6 | | HWY 146 | 6 | | MAIN ST | 6 | | RT. 2, BOX 151 | 6 | | TRAIL OF TEARS RD. | 6 | | ADAMS ST | 4 | | CAVE SPRINGS ROAD | 4 | | CEDAR GROVE ROAD | 4 | | COON HUNTER CLUB RD. | 4 | | DAVID OHSE RESIDENCE | 4 | | DEPUTY TOWER ROAD | 4 | | EDDYVILLE BLACKTOP | 4 | | HWY. 146 | 4 | | MT ZION CHURCH ROAD | 4 | | OFF CLARK ROAD | 4 | | OLD GOLCONDA RD | 4 | | OLD GOLCONDA ROAD | 4 | | ONE HORSE GAP ROAD | 4 | | RAUFUSS HILL PARK | 4 | | ROSALIE ST | 4 | | RT. 145 | 4 | | SHEDVILLE ROAD | 4 |
| | | Fire incidents reported |
|---|
| Sreet name | Count |
|---|
| TEMPLE HILL RD. | 4 | | TEMPLE HILL ROAD | 4 | | 1 MI SO OF 4-WAY IN GOLCONDA | 2 | | 1 MI WEST OF GOLCONDA | 2 | | 1 MI. FROM BROWNFIELD CHURCH | 2 | | 1 MI. NO. OF ANTIOC CHURCH | 2 | | 1 MI. OFF 145 | 2 | | 1 MI. SO. BIG BAY VALLEY RD. | 2 | | 1.5 MI. DOWN HOMBERG RD | 2 | | 1.5 MI. DOWN HOMBERG RD. | 2 | | 1/8 MI NO OF HWY. 147 | 2 | | 1/8 MI NO OF RT. 147 | 2 | | 10 TROVILLION LANE | 2 | | 110 EAST ROSALIE | 2 | | 110 TRAIL OF TEAR ROAD | 2 | | 111 JEFFERSON ST | 2 | | 12 MILLER DRIVE | 2 | | 134 STATE HWY 146 | 2 | | 14 MI OFF HWY 146 ON LUSK RD | 2 | | 146 AT TOP OF DIXON SPR. HILL | 2 | | 146 HWY | 2 | | 146 NO. OF GOLCONDA | 2 | | 146 NORTH OF GOLCONDA | 2 | | 146 W | 2 | | |
|
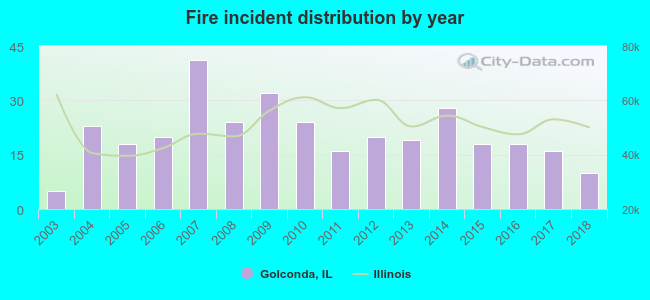 According to the data from the years 2003 - 2018 the average number of fires per year is 21. The highest number of reported fires - 41 took place in 2007, and the least - 5 in 2003. The data has a rising trend.
 24.7% incidents where reported in the morning and 75.3% in the evening. The most fires (16.9%) took place on Saturday, and the least (10.2%) on Tuesday.
 Based on the 332 reports from years 2003 - 2018 most fires (18.4%) took place during March, and the least (5.4%) in May.
 Out of all 428 cases reported during the years 2003 - 2018, the most belonged to the categories: Fire (77.6%), Rescue & EMS (9.3%), and Good Intent Call (6.3%).
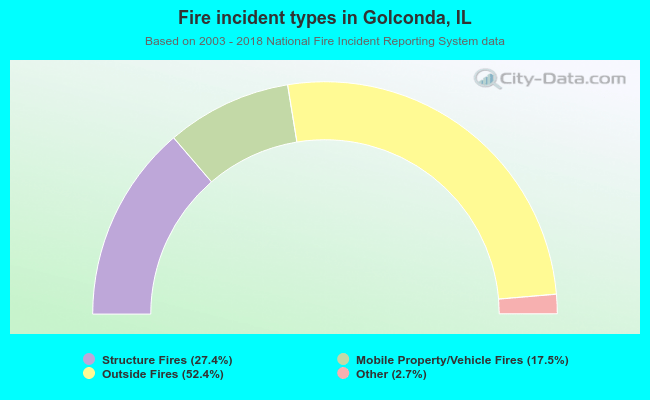 When looking into fire subcategories, the most reports belonged to: Outside Fires (52.4%), and Structure Fires (27.4%).