| Fire incidents reported |
|---|
| Sreet name | Count |
|---|
| JAMESTOWN ST | 38 | | BUFFALO ST | 22 | | PALMER ST | 14 | | SOUTH ROAD | 14 | | ALDRICH ST | 10 | | BROADWAY RD | 10 | | MAIN ST | 10 | | CHESTNUT ST | 8 | | BUSH RD | 6 | | PARK ST | 6 | | POINT PETER RD | 6 | | ROUTE 438 | 6 | | WATER ST | 6 | | ALLEN ST | 4 | | BUFFALO STREET | 4 | | GOWANDA ZOAR RD | 4 | | JAMESTOWN | 4 | | JAMESTOWN STREET | 4 | | JOHNSON ST | 4 | | MECHANIC ST | 4 | | MEMORIAL DRIVE | 4 | | PROSPECT ST | 4 | | SOUTH WATER ST | 4 | | ZOAR RD | 4 | | 100 MEMORIAL DRIVE DR | 2 |
| | | Fire incidents reported |
|---|
| Sreet name | Count |
|---|
| ALLEN ST EXT | 2 | | ALLEN ST EXT EXT | 2 | | ALLEN STREET EXT | 2 | | BAGDAD RD | 2 | | BROADWAY RD | 2 | | BROADWAY ROAD | 2 | | BROWN RD | 2 | | CAROLINE RD | 2 | | CEMETARY | 2 | | CEMETARY HILL RD | 2 | | CEMETRY HILL RD | 2 | | EAST MAIN ST | 2 | | ERIE AVE | 2 | | ERIE AVE AVE | 2 | | FOSTER RD | 2 | | FOSTER RD | 2 | | FOUR MILE LEVEL RD | 2 | | GOWAND ZOAR RD | 2 | | GOWANDA ZOAR | 2 | | GOWANDA-ZOAR RD | 2 | | HILL ST | 2 | | INDIAN HILL | 2 | | JAMES TOWN | 2 | | JAMESTOWN ST | 2 | | JOHNSON ST | 2 |
|
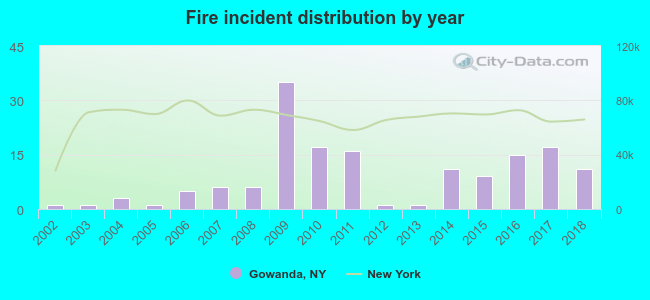 According to the data from the years 2002 - 2018 the average number of fires per year is 9. The highest number of reported fires - 35 took place in 2009, and the least - 1 in 2002. The data has an increasing trend.
 42.3% incidents where reported in the morning and 57.7% in the evening. The most fires (17.3%) took place on Thursday, and the least (8.3%) on Monday.
 According to the 156 fires from years 2002 - 2018 most fires (14.7%) took place during August, and the least (3.2%) in July.
 Out of all 996 cases reported during the years 2002 - 2018, the most belonged to the categories: Rescue & EMS (32.7%), Hazardous Condition (23.1%), and Fire (15.7%).
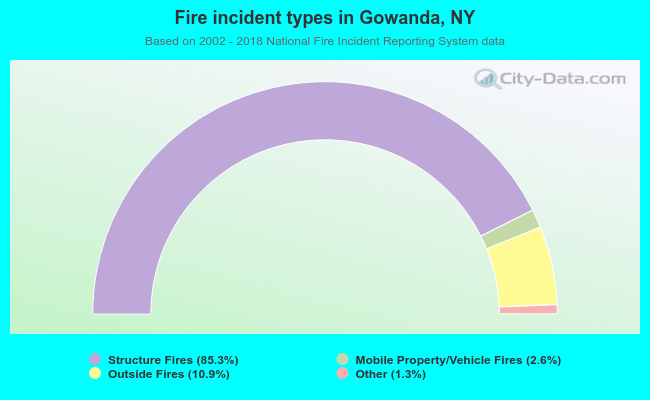 When looking into fire subcategories, the most incidents belonged to: Structure Fires (85.3%), and Outside Fires (10.9%).