Grant: Fire Incidents, Nebraska (NE)
Where are fire incidents reported in Grant, NE
Something went wrong! Please refresh the page.
|
| |||||||||||||||||||||||||||||||||||||||||||||||||||||||||||||||||||||||||||||||||||||||||||||||||||||||||||||
| Other | 32 | |||||||||||||||||||||||||||||||||||||||||||||||||||||||||||||||||||||||||||||||||||||||||||||||||||||||||||||
2002 - 2018 National Fire Incident Reporting System (NFIRS) incidents
- Incident types reported to NFIRS in Grant, NE
- 23144.5%Rescue & EMS
- 18435.5%Fire
- 316.0%Good Intent Call
- 305.8%False Alarm
- 265.0%Hazardous Condition
- 142.7%Severe Weather
- 20.4%Service Call
- 10.2%Overpressure Rupture
- Fire incident types reported to NFIRS in Grant, NE
- 10557.1%Outside Fires
- 3921.2%Structure Fires
- 3217.4%Mobile Property/Vehicle Fires
- 84.3%Other
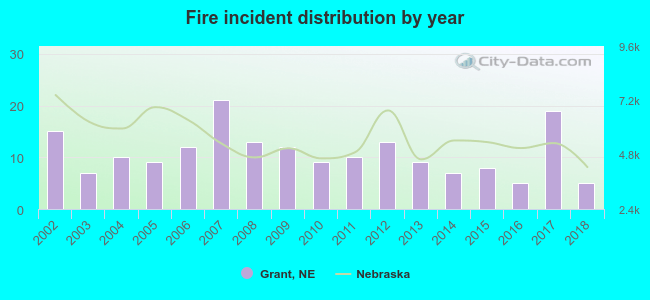 According to the data from the years 2002 - 2018 the average number of fires per year is 11. The highest number of reported fire incidents - 21 took place in 2007, and the least - 5 in 2016. The data has a declining trend.
 28.8% incidents where reported in the morning and 71.2% in the evening. The most fires (16.8%) took place on Wednesday, and the least (11.4%) on Thursday.
 Based on the 184 incident reports from years 2002 - 2018 most fires (15.8%) took place during July, and the least (3.8%) in October.
 Out of all 519 cases reported during the years 2002 - 2018, the most belonged to the categories: Rescue & EMS (44.5%), Fire (35.5%), and Good Intent Call (6.0%).
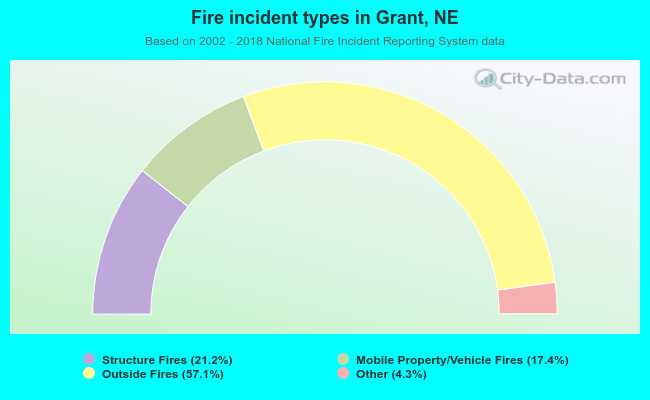 When looking into fire subcategories, the most incidents belonged to: Outside Fires (57.1%), and Structure Fires (21.2%).