Gravette: Fire Incidents, Arkansas (AR)
Where are fire incidents reported in Gravette, AR
Something went wrong! Please refresh the page.
|
| |||||||||||||||||||||||||||||||||||||||||||||||||||||||||||||||||||||||||||||||||||||||||||||||||||||||||||||
2002 - 2018 National Fire Incident Reporting System (NFIRS) incidents
- Incident types reported to NFIRS in Gravette, AR
- 1,41655.9%Rescue & EMS
- 48519.1%Fire
- 2309.1%Good Intent Call
- 1586.2%Hazardous Condition
- 1475.8%Service Call
- 672.6%False Alarm
- 261.0%Severe Weather
- 50.2%Special Incident
- Fire incident types reported to NFIRS in Gravette, AR
- 23448.2%Outside Fires
- 19039.2%Structure Fires
- 479.7%Mobile Property/Vehicle Fires
- 142.9%Other
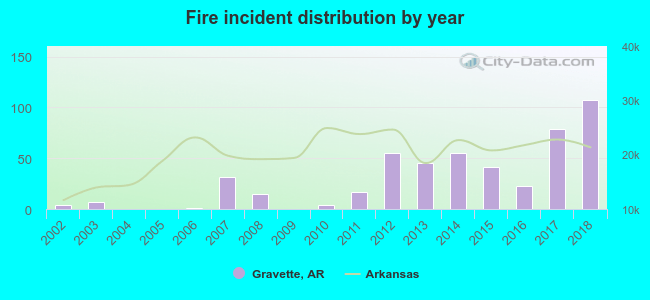 According to the data from the years 2002 - 2018 the average number of fires per year is 29. The highest number of fires - 107 took place in 2018, and the least - 0 in 2004. The data has an increasing trend.
 28.2% incidents where reported in the morning and 71.8% in the evening. The most fires (16.1%) took place on Wednesday, and the least (13.4%) on Thursday.
 According to the 485 reports from years 2002 - 2018 most fires (13.0%) took place during January, and the least (5.4%) in September.
 Out of all 2,534 cases reported during the years 2002 - 2018, the most belonged to the categories: Overpressure Rupture (55.9%), Fire (19.1%), and Service Call (9.1%).
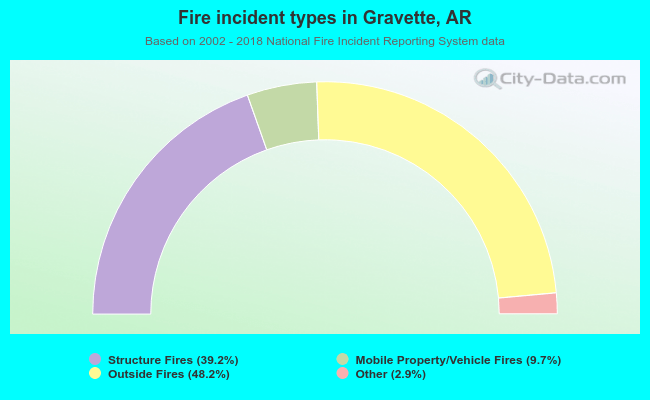 When looking into fire subcategories, the most incidents belonged to: Outside Fires (48.2%), and Structure Fires (39.2%).