Greenbelt: Fire Incidents, Maryland (MD)
Where are fire incidents reported in Greenbelt, MD
Something went wrong! Please refresh the page.
|
| |||||||||||||||||||||||||||||||||||||||||||||||||||||||||||||||||||||||||||||||||||||||||||||||||||||||||||||
2009 - 2018 National Fire Incident Reporting System (NFIRS) incidents
- Incident types reported to NFIRS in Greenbelt, MD
- 3,07086.7%Rescue & EMS
- 1865.3%Fire
- 1113.1%Hazardous Condition
- 702.0%False Alarm
- 551.6%Good Intent Call
- 411.2%Service Call
- Fire incident types reported to NFIRS in Greenbelt, MD
- 7741.4%Structure Fires
- 6333.9%Mobile Property/Vehicle Fires
- 2614.0%Other
- 2010.8%Outside Fires
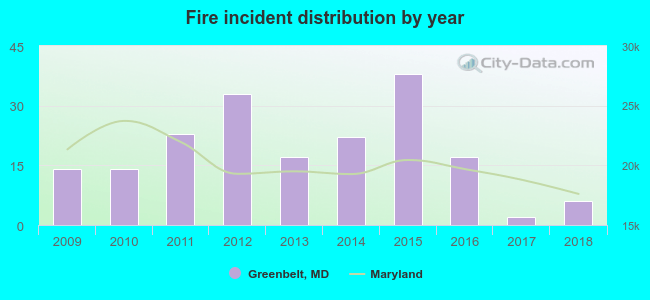 Based on the data from the years 2009 - 2018 the average number of fires per year is 19. The highest number of fires - 38 took place in 2015, and the least - 2 in 2017. The data has a dropping trend.
The average number of yearly fire incidents per 10k residents in Greenbelt, MD compared to nearest cities:
(Note: Based on data for the last 3 years, including only cities with population 5,000 and above)
| Greenbelt: | 3.5 |
| College Park: | 2.5 |
| Lanham: | 14.1 |
| Beltsville: | 17.5 |
| Adelphi: | 1.1 |
| Hyattsville: | 52.8 |
| Glenn Dale: | 1.0 |
| Landover: | 3.2 |
| Bladensburg: | 3.5 |
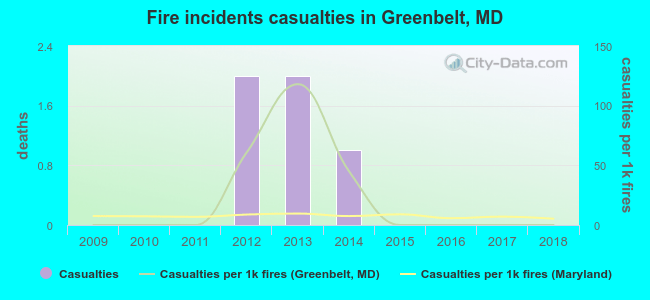 According to the reports from the years 2009 - 2018 the average number of fire-related yearly casualties is 1. The highest number of casualties - 2 took place in 2012, and the lowest - 0 in 2009. The data has a constant trend.
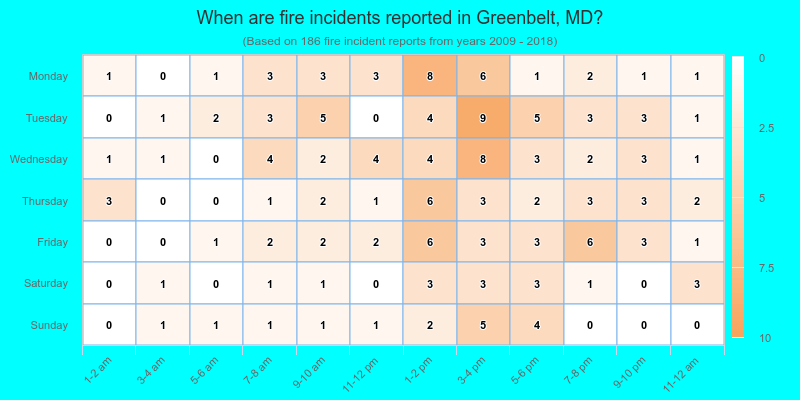
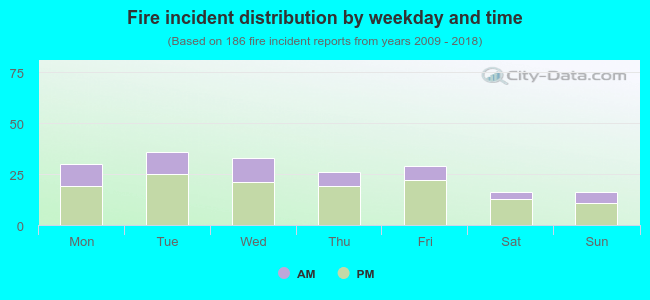 30.1% incidents where reported in the morning and 69.9% in the evening. The most fires (19.4%) took place on Tuesday, and the least (8.6%) on Saturday.
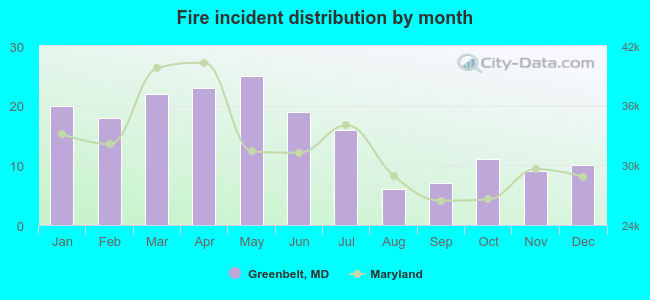 According to the 186 reports from years 2009 - 2018 most fires (13.4%) took place during May, and the least (3.2%) in August.
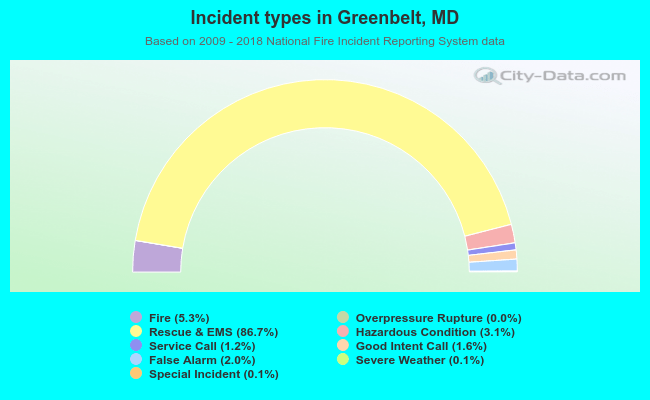 Out of all 3,539 cases reported during the years 2009 - 2018, the most belonged to the categories: Rescue & EMS (86.7%), Fire (5.3%), and Hazardous Condition (3.1%).
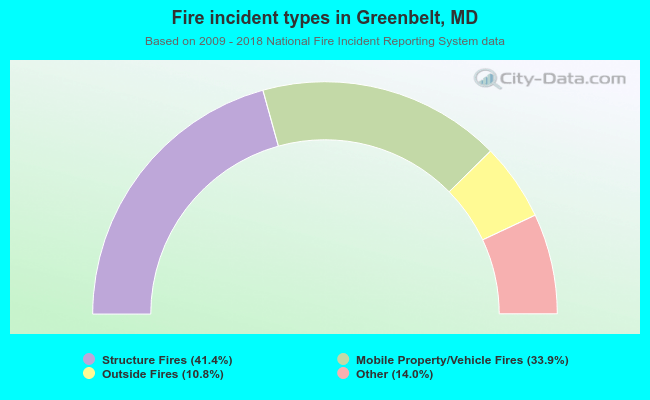 When looking into fire subcategories, the most incidents belonged to: Structure Fires (41.4%), and Mobile Property/Vehicle Fires (33.9%).