Greendale: Fire Incidents, Wisconsin (WI)
Where are fire incidents reported in Greendale, WI
Something went wrong! Please refresh the page.
|
| |||||||||||||||||||||||||||||||||||||||||||||||||||||||||||||||||||||||||||||||||||||||||||||||||||||||||||||
2002 - 2018 National Fire Incident Reporting System (NFIRS) incidents
- Incident types reported to NFIRS in Greendale, WI
- 3,35665.2%Rescue & EMS
- 56310.9%Hazardous Condition
- 3637.1%False Alarm
- 3526.8%Fire
- 3486.8%Service Call
- 1492.9%Good Intent Call
- 70.1%Overpressure Rupture
- Fire incident types reported to NFIRS in Greendale, WI
- 17950.9%Structure Fires
- 8624.4%Outside Fires
- 4412.5%Mobile Property/Vehicle Fires
- 4312.2%Other
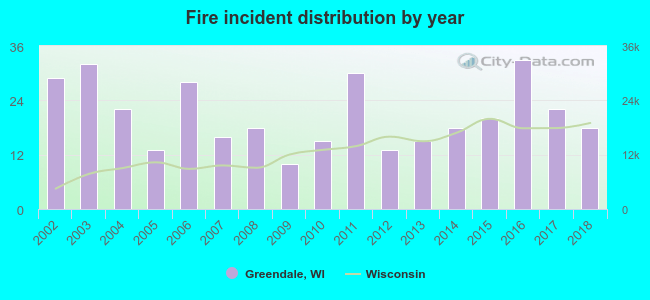 According to the data from the years 2002 - 2018 the average number of fires per year is 21. The highest number of fires - 33 took place in 2016, and the least - 10 in 2009. The data has a decreasing trend.
The average number of yearly fire incidents per 10k residents in Greendale, WI compared to nearest cities:
(Note: Based on data for the last 3 years, including only cities with population 5,000 and above)
| Greendale: | 17.0 |
| Greenfield: | 14.3 |
| Franklin: | 22.7 |
| Hales Corners: | 25.4 |
| West Allis: | 18.9 |
| Oak Creek: | 30.0 |
| New Berlin: | 28.9 |
| Cudahy: | 31.1 |
| Muskego: | 17.2 |
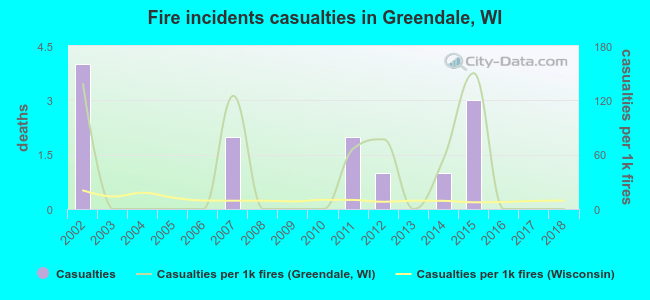 According to the data from the years 2002 - 2018 the average number of fire-related casualties per year is 1. The highest number of reported casualties - 4 took place in 2002, and the lowest - 0 in 2003. The data has a declining trend.
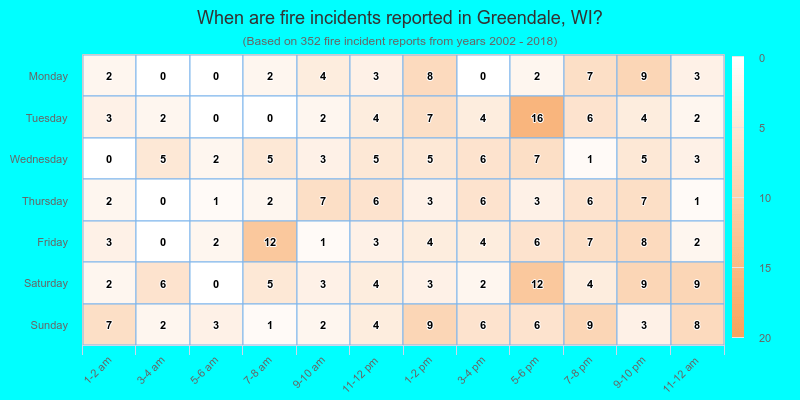
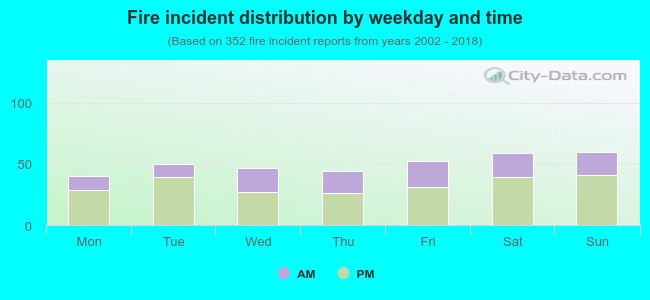 34.1% incidents where reported in the morning and 65.9% in the evening. The most fires (17.0%) took place on Sunday, and the least (11.4%) on Monday.
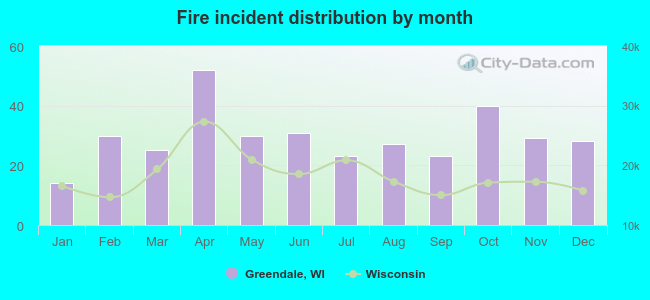 Based on the 352 fires from years 2002 - 2018 most fires (14.8%) took place during April, and the least (4.0%) in January.
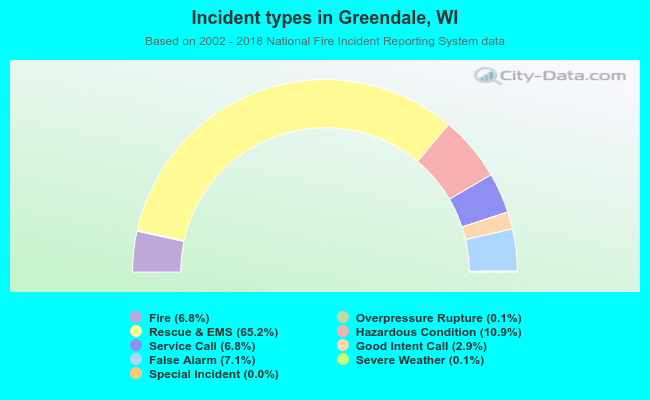 Out of all 5,145 cases reported during the years 2002 - 2018, the most belonged to the categories: Rescue & EMS (65.2%), Hazardous Condition (10.9%), and False Alarm (7.1%).
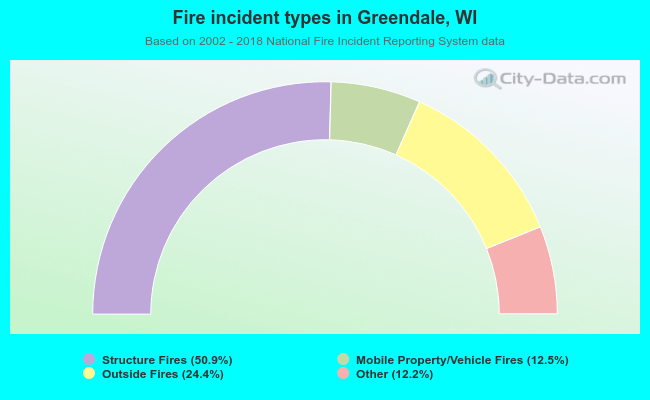 When looking into fire subcategories, the most incidents belonged to: Structure Fires (50.9%), and Outside Fires (24.4%).