| Fire incidents reported |
|---|
| Sreet name | Count |
|---|
| PORTSMOUTH AVE | 60 | | POST RD | 26 | | I95 HWY | 22 | | MUTUAL AID GIVEN | 20 | | INTERSTATE 95 | 18 | | OCEAN RD | 18 | | BAYSIDE RD | 12 | | PORTSMOUTH AVENUE | 12 | | GREENLAND RD | 10 | | MOULTON AVE | 10 | | WINNICUIT RD | 10 | | INTERSTATE 95 HWY | 8 | | BREAKFAST HILL RD | 6 | | GREAT BAY RD | 6 | | HOLLY LN | 6 | | MAPLE DR | 6 | | NEWINGTON RD | 6 | | PORTSMOUTH AVE | 6 | | RIVERSIDE DR | 6 | | SPRING HILL RD | 6 | | TUTTLE LN | 6 | | BAYRIDGE DR | 4 | | BROWN AVE | 4 | | I-95 | 4 | | MEADOW LN | 4 |
| | | Fire incidents reported |
|---|
| Sreet name | Count |
|---|
| PALM DR | 4 | | SLEEPY HOLLOW | 4 | | SLEEPY HOLLOW DR | 4 | | TOWER PL | 4 | | 20 HOLLY LANE | 2 | | 239 A DEARBORN ROAD | 2 | | 95 NORTHBOUND | 2 | | 95 SB | 2 | | 95 SOUTHBOUND MM9 | 2 | | 95 SOUTHBOUND RTE | 2 | | BASS ST | 2 | | BAY RIDGE RD | 2 | | BAY RIDGE RD | 2 | | BAY RIDGE ROAD | 2 | | BAY RIDGE ROAD | 2 | | BAY SHORE DR | 2 | | BAYRIDGE | 2 | | BAYSIDE ROAD | 2 | | BERRY FARM RD | 2 | | BERRY LN | 2 | | BERRY LN. | 2 | | BRACKETT'S POINT RD. RD | 2 | | BRAVE BOAT HARBOR RD | 2 | | BREAKFAST HILL RD | 2 | | |
|
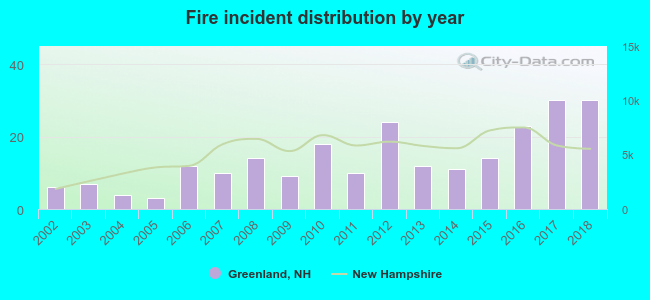 Based on the data from the years 2002 - 2018 the average number of fires per year is 14. The highest number of reported fire incidents - 30 took place in 2017, and the least - 3 in 2005. The data has a growing trend.
 28.3% incidents where reported in the morning and 71.7% in the evening. The most fires (18.1%) took place on Saturday, and the least (8.9%) on Monday.
 Based on the 237 reports from years 2002 - 2018 most fires (17.7%) took place during April, and the least (5.5%) in February.
 Out of all 2,473 cases reported during the years 2002 - 2018, the most belonged to the categories: Rescue & EMS (49.7%), Hazardous Condition (15.2%), and False Alarm (13.1%).
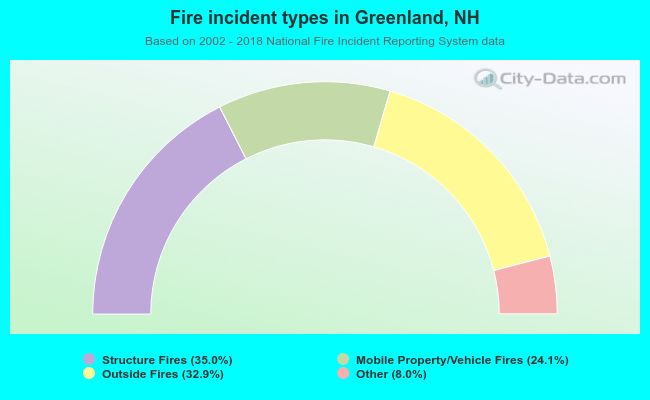 When looking into fire subcategories, the most incidents belonged to: Structure Fires (35.0%), and Outside Fires (32.9%).