Greenleaf: Fire Incidents, Wisconsin (WI)
Where are fire incidents reported in Greenleaf, WI
Something went wrong! Please refresh the page.
|
| |||||||||||||||||||||||||||||||||||||||||||||||||||||||||||||||||||||||||||||||||||||||||||||||||||||||||||||
| Other | 6 | |||||||||||||||||||||||||||||||||||||||||||||||||||||||||||||||||||||||||||||||||||||||||||||||||||||||||||||
2004 - 2018 National Fire Incident Reporting System (NFIRS) incidents
- Incident types reported to NFIRS in Greenleaf, WI
- 45854.5%Fire
- 13315.8%Rescue & EMS
- 12114.4%Hazardous Condition
- 536.3%Good Intent Call
- 425.0%False Alarm
- 242.9%Service Call
- 40.5%Severe Weather
- 40.5%Special Incident
- 10.1%Overpressure Rupture
- Fire incident types reported to NFIRS in Greenleaf, WI
- 26056.8%Structure Fires
- 12226.6%Outside Fires
- 5311.6%Mobile Property/Vehicle Fires
- 235.0%Other
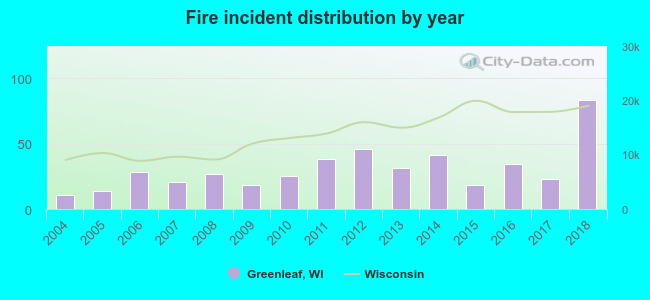 According to the data from the years 2004 - 2018 the average number of fires per year is 31. The highest number of reported fires - 83 took place in 2018, and the least - 11 in 2004. The data has a growing trend.
 36.9% incidents where reported in the morning and 63.1% in the evening. The most fires (17.0%) took place on Sunday, and the least (11.1%) on Saturday.
 Based on the 458 incident reports from years 2004 - 2018 most fires (15.5%) took place during March, and the least (5.0%) in December.
 Out of all 840 cases reported during the years 2004 - 2018, the most belonged to the categories: Fire (54.5%), Rescue & EMS (15.8%), and Hazardous Condition (14.4%).
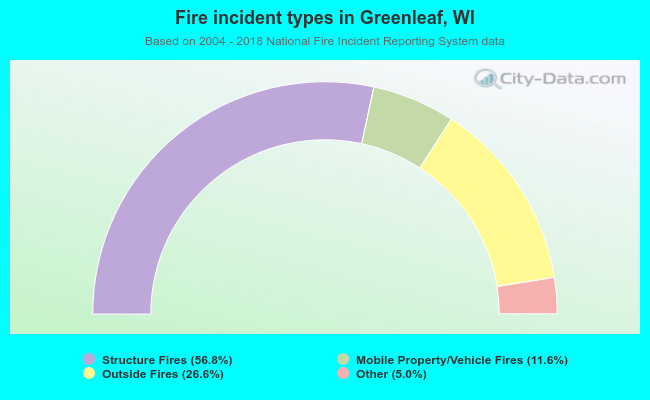 When looking into fire subcategories, the most incidents belonged to: Structure Fires (56.8%), and Outside Fires (26.6%).