Greenville: Fire Incidents, Wisconsin (WI)
Where are fire incidents reported in Greenville, WI
Something went wrong! Please refresh the page.
|
| |||||||||||||||||||||||||||||||||||||||||||||||||||||||||||||||||||||||||||||||||||||||||||||||||||||||||||||
2002 - 2018 National Fire Incident Reporting System (NFIRS) incidents
- Incident types reported to NFIRS in Greenville, WI
- 56941.6%Hazardous Condition
- 24117.6%Fire
- 20414.9%False Alarm
- 1198.7%Good Intent Call
- 1108.0%Service Call
- 1087.9%Rescue & EMS
- 110.8%Special Incident
- 40.3%Severe Weather
- 20.1%Overpressure Rupture
- Fire incident types reported to NFIRS in Greenville, WI
- 10543.6%Structure Fires
- 7631.5%Outside Fires
- 3614.9%Mobile Property/Vehicle Fires
- 2410.0%Other
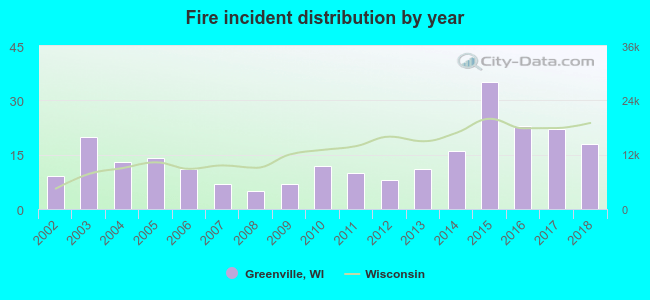 According to the data from the years 2002 - 2018 the average number of fires per year is 14. The highest number of reported fires - 35 took place in 2015, and the least - 5 in 2008. The data has a growing trend.
The average number of yearly fire incidents per 10k residents in Greenville, WI compared to nearest cities:
(Note: Based on data for the last 3 years, including only cities with population 5,000 and above)
| Greenville: | 20.4 |
| Grand Chute: | 32.3 |
| Appleton: | 17.6 |
| Menasha: | 31.6 |
| Neenah: | 32.4 |
| Kimberly: | 14.9 |
| New London: | 51.3 |
| Little Chute: | 11.4 |
| Harrison: | 9.8 |

 30.3% incidents where reported in the morning and 69.7% in the evening. The most fires (20.7%) took place on Tuesday, and the least (10.8%) on Friday.
 Based on the 241 incident reports from years 2002 - 2018 most fires (12.0%) took place during February, and the least (5.0%) in March.
 Out of all 1,368 cases reported during the years 2002 - 2018, the most belonged to the categories: Hazardous Condition (41.6%), Fire (17.6%), and False Alarm (14.9%).
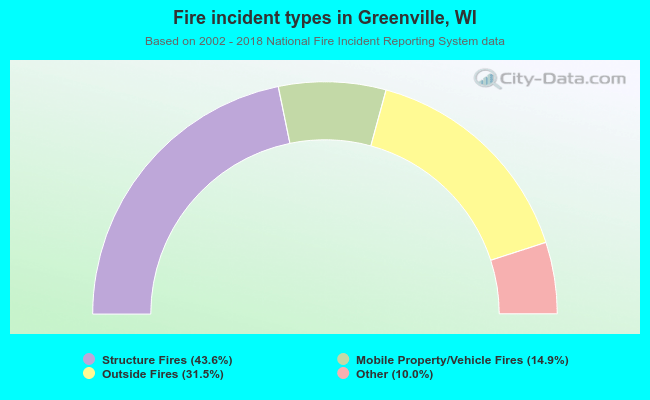 When looking into fire subcategories, the most incidents belonged to: Structure Fires (43.6%), and Outside Fires (31.5%).