| Fire incidents reported |
|---|
| Sreet name | Count |
|---|
| YE GREATE ST | 20 | | OLD STAGECOACH RD | 18 | | HOSPITAL RD | 12 | | PIER RD | 10 | | SHILOH PIKE | 10 | | SUNNY SLOPE DR | 8 | | BACONS NECK RD | 6 | | BERKLEY RD | 6 | | ROADSTOWN RD | 6 | | SHEPPARDS MILL RD | 6 | | 57 RT | 4 | | BAYSIDE RD | 4 | | BRIDGETON RD | 4 | | CHESNUT RD | 4 | | GUM TREE CORNER RD | 4 | | HARMONY RD | 4 | | OLD COHANSEY RD | 4 | | SPRINGTOWN RD | 4 | | STATE HIGHWAY ROUTE #49 HWY | 4 | | STATHEM'S NECK RD | 4 | | 1 PIER RD | 2 | | 1135 GUM TREE CORNER RD | 2 | | 1209 ROUTE 22 | 2 | | 57 HWY | 2 | | ALLEN AVE | 2 |
| | | Fire incidents reported |
|---|
| Sreet name | Count |
|---|
| ASHTON AVE | 2 | | ATKINSON RD | 2 | | BIG OAK RD | 2 | | BROAD ST | 2 | | BROADWAY WAY | 2 | | CEDAR ST | 2 | | ELMER RD | 2 | | GREENWICH RD | 2 | | GUM TREE CORNER ROAD RD | 2 | | HAMILTON DR | 2 | | HOLDING RD | 2 | | HOMESTEAD PL | 2 | | HUDSON ST | 2 | | INTERSTATE 295 HWY | 2 | | JOHN DARE RD | 2 | | MACANIPUK RD | 2 | | MAIN ST | 2 | | MAIN STREET | 2 | | MARKET LANE | 2 | | MULLEN ST | 2 | | N REPAUNO AVE | 2 | | OAK DR | 2 | | OLD MILL RD | 2 | | OSBORN LANE | 2 | | |
|
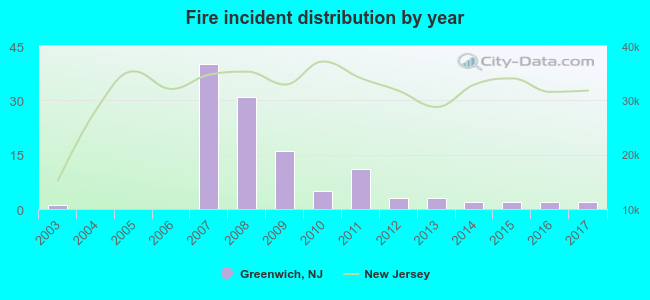 Based on the data from the years 2003 - 2017 the average number of fires per year is 8. The highest number of fire incidents - 40 took place in 2007, and the least - 0 in 2004. The data has an increasing trend.
 37.3% incidents where reported in the morning and 62.7% in the evening. The most fires (18.6%) took place on Saturday, and the least (9.3%) on Thursday.
 According to the 118 fire incident reports from years 2003 - 2017 most fires (14.4%) took place during July, and the least (2.5%) in September.
 Out of all 146 cases reported during the years 2003 - 2017, the most belonged to the categories: Fire (80.8%), Rescue & EMS (7.5%), and Service Call (4.8%).
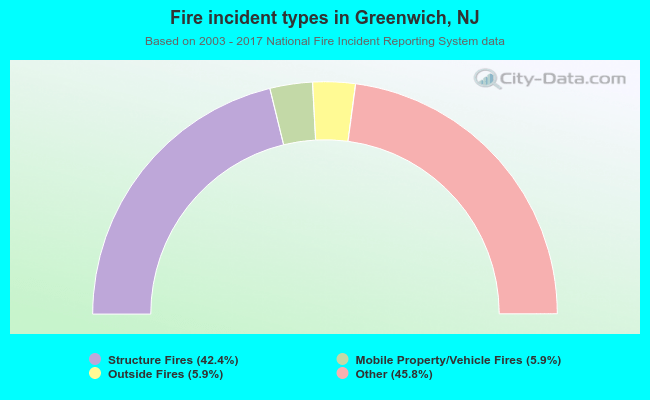 When looking into fire subcategories, the most reports belonged to: Other (45.8%), and Structure Fires (42.4%).