| Fire incidents reported |
|---|
| Sreet name | Count |
|---|
| GURLEY PIKE | 200 | | KEEL MOUNTAIN RD | 139 | | HURRICANE CREEK RD | 136 | | ACUFF RD | 110 | | BROCK RD | 44 | | KILLINGSWORTH COVE RD | 42 | | BLOWING CAVE RD | 40 | | LITTLE COVE RD | 38 | | REUNION OAKS DR | 35 | | HIGHWAY 72 | 32 | | LAUREL LN | 30 | | SALTY BOTTOM RD | 30 | | COUNTY LAKE RD | 28 | | 72 EAST HWY | 25 | | RANGE RD | 25 | | RASCALS RUN | 24 | | 72 HWY | 23 | | BERRY HOLLOW RD | 22 | | KEELS MOUNTAIN RD | 20 | | CHILDRESS ST | 18 | | HIGHWAY 72 HWY | 16 | | BROWNSBORO RD | 15 | | HIGHWAY 72 EAST HWY | 15 | | NEAL DR | 15 | | WALKER ST | 15 |
| | | Fire incidents reported |
|---|
| Sreet name | Count |
|---|
| WILDROSE LN | 15 | | JOPLIN ST | 14 | | HIGHWAY 72 EAST | 13 | | JENKINS ST | 13 | | MCMULLEN RD | 13 | | SECTION LINE RD | 13 | | KEEL MOUNTAIN RD. RD | 12 | | BLACK HAWK RD | 10 | | DUDLEY RD | 10 | | HIGH BLUFF DR | 10 | | HILLSDALE DR | 10 | | J PAYTON CIR | 10 | | MARLIE LN | 10 | | SHARPS COVE RD | 10 | | STAPLER RD | 10 | | STYLES DR | 10 | | WINTERVIEW DR | 10 | | CHERRY TREE RD | 9 | | CHURCH ST | 9 | | LOW GAP RD | 9 | | RIDGE TRL | 9 | | VICTORIANROSE LN | 9 | | KEEL"S MOUNTAIN RD | 8 | | STAPLER RD. RD | 8 | | |
|
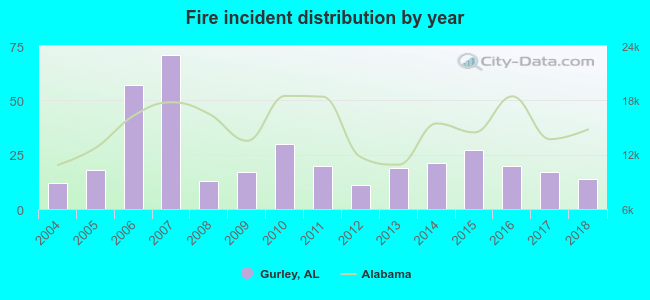 Based on the data from the years 2004 - 2018 the average number of fire incidents per year is 24. The highest number of fire incidents - 71 took place in 2007, and the least - 11 in 2012. The data has a rising trend.
 30.7% incidents where reported in the morning and 69.3% in the evening. The most fires (19.8%) took place on Saturday, and the least (11.1%) on Tuesday.
 According to the 368 fire incidents from years 2004 - 2018 most fires (12.0%) took place during March, and the least (4.6%) in December.
 Out of all 1,253 cases reported during the years 2004 - 2018, the most belonged to the categories: Rescue & EMS (51.6%), Fire (29.4%), and Good Intent Call (9.7%).
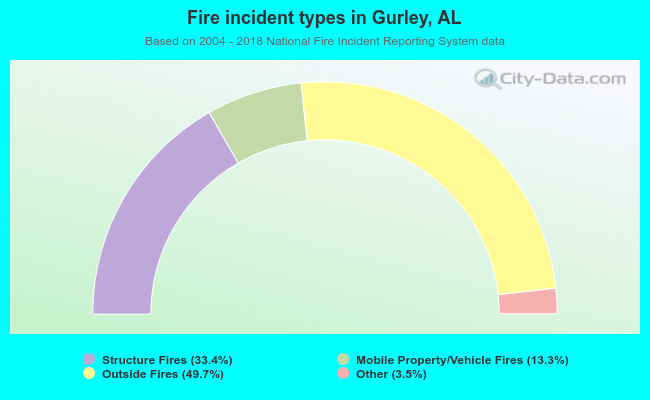 When looking into fire subcategories, the most incidents belonged to: Outside Fires (49.7%), and Structure Fires (33.4%).