Hamburg: Fire Incidents, Arkansas (AR)
Where are fire incidents reported in Hamburg, AR
Something went wrong! Please refresh the page.
|
| |||||||||||||||||||||||||||||||||||||||||||||||||||||||||||||||||||||||||||||||||||||||||||||||||||||||||||||
| Other | 134 | |||||||||||||||||||||||||||||||||||||||||||||||||||||||||||||||||||||||||||||||||||||||||||||||||||||||||||||
2003 - 2018 National Fire Incident Reporting System (NFIRS) incidents
- Incident types reported to NFIRS in Hamburg, AR
- 48089.1%Fire
- 264.8%Hazardous Condition
- 213.9%Good Intent Call
- 71.3%Service Call
- 30.6%Rescue & EMS
- 20.4%False Alarm
- Fire incident types reported to NFIRS in Hamburg, AR
- 26354.8%Outside Fires
- 13127.3%Structure Fires
- 7415.4%Mobile Property/Vehicle Fires
- 122.5%Other
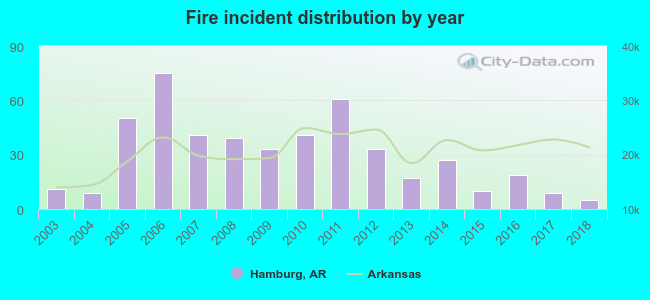 Based on the data from the years 2003 - 2018 the average number of fire incidents per year is 30. The highest number of fires - 75 took place in 2006, and the least - 5 in 2018. The data has a declining trend.
 27.5% incidents where reported in the morning and 72.5% in the evening. The most fires (16.9%) took place on Tuesday, and the least (11.5%) on Monday.
 According to the 480 fire incident reports from years 2003 - 2018 most fires (12.5%) took place during January, and the least (4.8%) in May.
 Out of all 539 cases reported during the years 2003 - 2018, the most belonged to the categories: Fire (89.1%), Rescue & EMS (4.8%), and Service Call (3.9%).
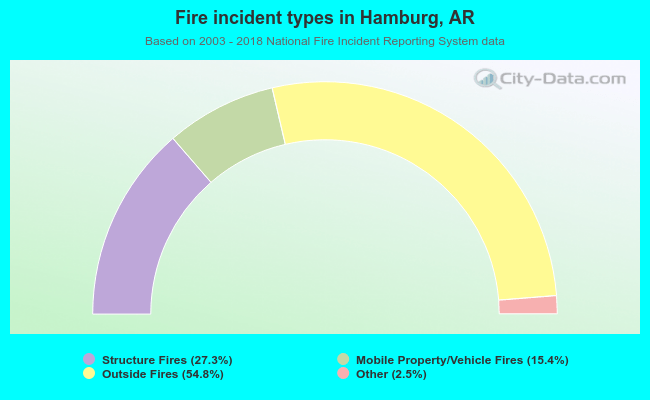 When looking into fire subcategories, the most reports belonged to: Outside Fires (54.8%), and Structure Fires (27.3%).