| Fire incidents reported |
|---|
| Sreet name | Count |
|---|
| MAIN ST | 6 | | MAIN STREET | 6 | | 87 SOUTH MAIN ST | 4 | | BUNKER HILL RD | 4 | | CENTER RD | 4 | | GLENSIDE AVE | 4 | | MICHAUD FARM ROAD | 4 | | MILL ST | 4 | | MOUNTAIN VIEW RD | 4 | | SOUTH MAIN ST | 4 | | TOWN FARM RD | 4 | | 10 SWALLOW HILL | 2 | | 119 TOWN ROAD | 2 | | 119 WEST CHURCH ST | 2 | | 123 PROSPECT ST | 2 | | 128 TOWN FARM RD | 2 | | 137 HIGH ST | 2 | | 15 WAKEFIELD AVE | 2 | | 1518 RT 14 NORTH | 2 | | 1531 BUNKER HILL | 2 | | 1672 VT RT 15 | 2 | | 1795 HOPKINS RD | 2 | | 1968 CENTER RD | 2 | | 20 WAKEFIELD ST. | 2 | | 2141 RT. 15 WEST | 2 |
| | | Fire incidents reported |
|---|
| Sreet name | Count |
|---|
| 216 RT 14 | 2 | | 229 ELM ST | 2 | | 2383 CENTER RD. | 2 | | 24 JENNE RD. | 2 | | 29 ROCKY CIRCLE | 2 | | 2992 CENTER RD. | 2 | | 308 RT.14 SOUTH | 2 | | 35 UPPER CHERRY ST | 2 | | 38 SLAPP HILL | 2 | | 400 SOUTH MAIN ST | 2 | | 46 GOOD PLACE | 2 | | 656 STRATTON RD | 2 | | 75 MILL ST | 2 | | 79 CHURCH ST | 2 | | 83 ELM ST LGTS | 2 | | BEMIS BLOCK | 2 | | BILLINGS RD | 2 | | BUNKER HILL RD RD | 2 | | CATAMOUNT RD | 2 | | CATAMOUNT ROAD | 2 | | CENTRAL ST | 2 | | CHURCH ST | 2 | | CHURCH STREET | 2 | | CHURCH STREET ST | 2 | | |
|
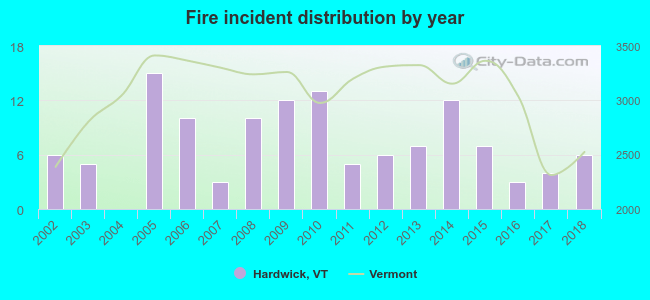 According to the data from the years 2002 - 2018 the average number of fire incidents per year is 7. The highest number of fire incidents - 15 took place in 2005, and the least - 0 in 2004. The data has a constant trend.
 33.1% incidents where reported in the morning and 66.9% in the evening. The most fires (25.8%) took place on Friday, and the least (4.0%) on Tuesday.
 Based on the 124 fire incidents from years 2002 - 2018 most fires (22.6%) took place during November, and the least (1.6%) in September.
 Out of all 278 cases reported during the years 2002 - 2018, the most belonged to the categories: Fire (44.6%), Rescue & EMS (19.4%), and Overpressure Rupture (17.3%).
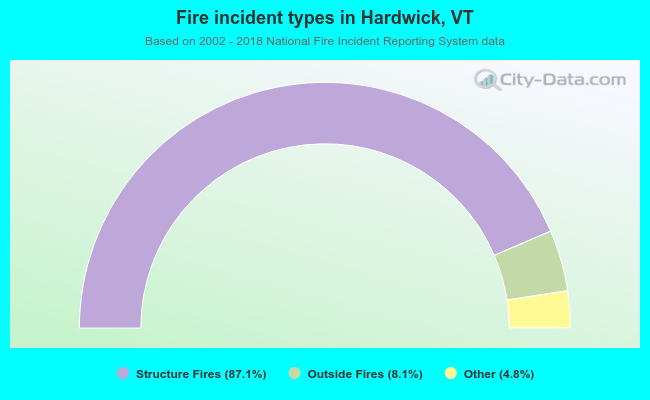 When looking into fire subcategories, the most reports belonged to: Structure Fires (87.1%), and Mobile Property/Vehicle Fires (8.1%).