Harleysville: Fire Incidents, Pennsylvania (PA)
Where are fire incidents reported in Harleysville, PA
Something went wrong! Please refresh the page.
|
| |||||||||||||||||||||||||||||||||||||||||||||||||||||||||||||||||||||||||||||||||||||||||||||||||||||||||||||
2003 - 2018 National Fire Incident Reporting System (NFIRS) incidents
- Incident types reported to NFIRS in Harleysville, PA
- 19046.9%Fire
- 6716.5%Hazardous Condition
- 5714.1%False Alarm
- 4511.1%Rescue & EMS
- 297.2%Good Intent Call
- 133.2%Service Call
- 30.7%Special Incident
- 10.2%Overpressure Rupture
- Fire incident types reported to NFIRS in Harleysville, PA
- 13571.1%Structure Fires
- 3518.4%Outside Fires
- 105.3%Mobile Property/Vehicle Fires
- 105.3%Other
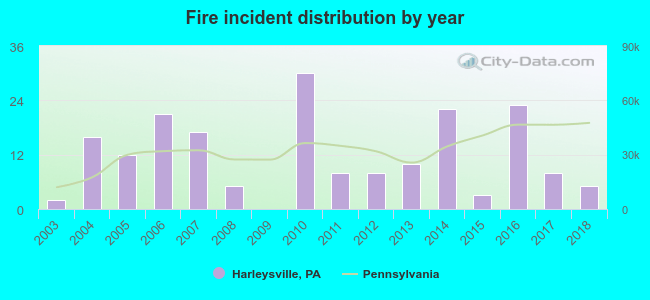 Based on the data from the years 2003 - 2018 the average number of fires per year is 12. The highest number of reported fires - 30 took place in 2010, and the least - 0 in 2009. The data has a growing trend.
The average number of yearly fire incidents per 10k residents in Harleysville, PA compared to nearest cities:
(Note: Based on data for the last 3 years, including only cities with population 5,000 and above)
| Harleysville: | 12.9 |
| Souderton: | 31.2 |
| Lansdale: | 10.5 |
| Collegeville: | 88.9 |
| Perkasie: | 85.3 |
| Montgomeryville: | 26.9 |
| Trooper: | 7.5 |
| East Norriton: | 30.3 |
| West Norriton: | 4.1 |
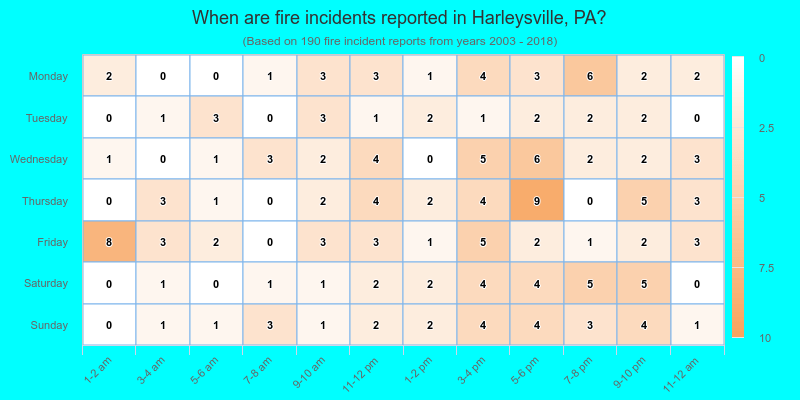
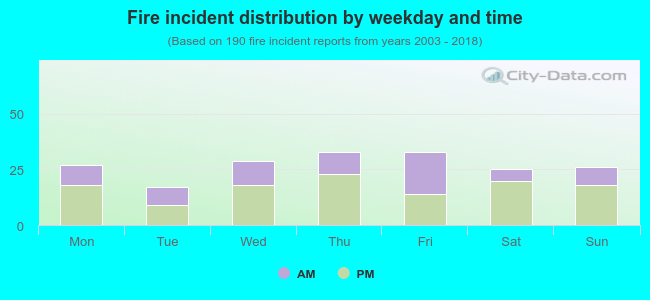 36.8% incidents where reported in the morning and 63.2% in the evening. The most fires (17.4%) took place on Thursday, and the least (8.9%) on Tuesday.
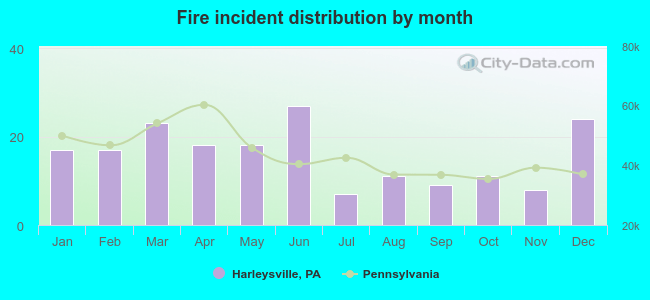 According to the 190 fires from years 2003 - 2018 most fires (14.2%) took place during June, and the least (3.7%) in July.
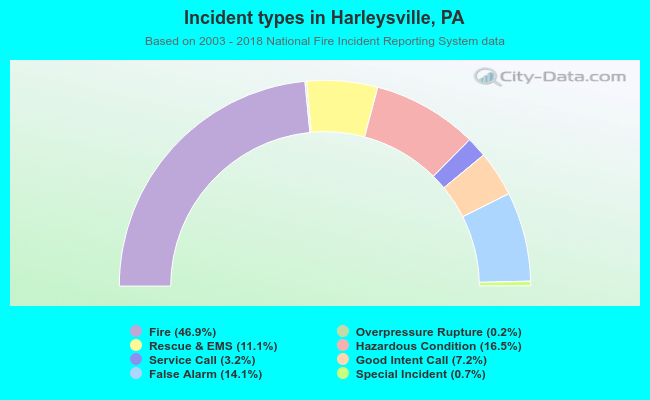 Out of all 405 cases reported during the years 2003 - 2018, the most belonged to the categories: Fire (46.9%), Hazardous Condition (16.5%), and False Alarm (14.1%).
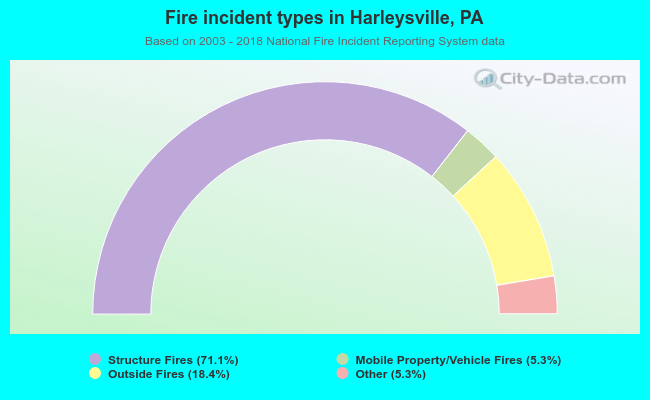 When looking into fire subcategories, the most incidents belonged to: Structure Fires (71.1%), and Outside Fires (18.4%).