Hebron: Fire Incidents, Nebraska (NE)
Where are fire incidents reported in Hebron, NE
Something went wrong! Please refresh the page.
|
| |||||||||||||||||||||||||||||||||||||||||||||||||||||||||||||||||||||||||||||||||||||||||||||||||||||||||||||
| Other | 42 | |||||||||||||||||||||||||||||||||||||||||||||||||||||||||||||||||||||||||||||||||||||||||||||||||||||||||||||
2002 - 2017 National Fire Incident Reporting System (NFIRS) incidents
- Incident types reported to NFIRS in Hebron, NE
- 24667.8%Fire
- 328.8%Hazardous Condition
- 267.2%False Alarm
- 256.9%Rescue & EMS
- 185.0%Good Intent Call
- 71.9%Severe Weather
- 30.8%Overpressure Rupture
- 30.8%Service Call
- 30.8%Special Incident
- Fire incident types reported to NFIRS in Hebron, NE
- 13956.5%Outside Fires
- 4819.5%Structure Fires
- 4819.5%Mobile Property/Vehicle Fires
- 114.5%Other
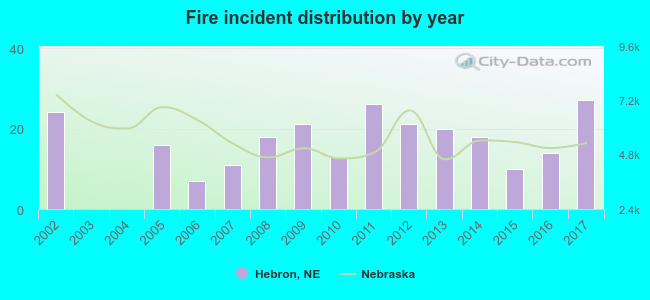 Based on the data from the years 2002 - 2017 the average number of fires per year is 15. The highest number of fire incidents - 27 took place in 2017, and the least - 0 in 2003. The data has a growing trend.
 26.4% incidents where reported in the morning and 73.6% in the evening. The most fires (19.9%) took place on Wednesday, and the least (10.2%) on Friday.
 Based on the 246 reports from years 2002 - 2017 most fires (20.7%) took place during March, and the least (4.5%) in June.
 Out of all 363 cases reported during the years 2002 - 2017, the most belonged to the categories: Fire (67.8%), Hazardous Condition (8.8%), and False Alarm (7.2%).
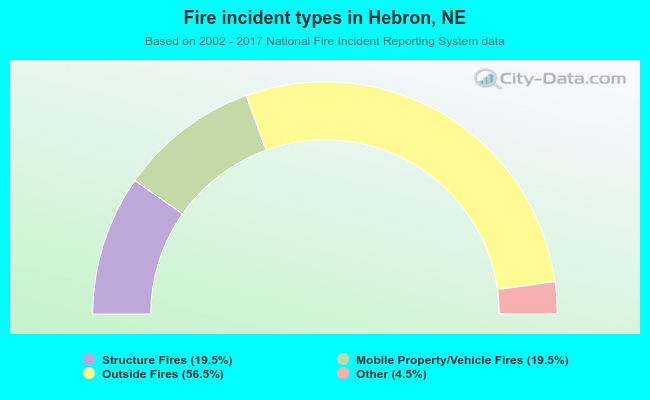 When looking into fire subcategories, the most reports belonged to: Outside Fires (56.5%), and Structure Fires (19.5%).