| Fire incidents reported |
|---|
| Sreet name | Count |
|---|
| NYS ROUTE 3 | 14 | | COUNTY ROUTE 123 | 10 | | COUNTY ROUTE 71 | 8 | | GRANDJEAN ROAD | 8 | | NYS ROUTE 178 | 8 | | TOWN BARN RD | 8 | | LASHER ROAD | 6 | | STATE ROUTE 178 | 6 | | AYLES ROAD | 4 | | COUNTY ROUTE 152 | 4 | | COUNTY ROUTE 72 | 4 | | COUNTY ROUTE 75 | 4 | | HOVEY COVE LANE | 4 | | JOHNS LANE | 4 | | NUTTING STREET ROAD | 4 | | SHEAR RD | 4 | | WINDMILL ROAD | 4 | | 10332 COUNTY ROUTE 152 | 2 | | 11619 TOWN BARN RD | 2 | | 12478 COUNTY ROUTE 72 | 2 | | 12876 CO RT 72 | 2 | | 13408 CO RT 123 | 2 | | 178 RT | 2 | | 3650 NORTH WHITES BAY RD | 2 | | 5639 LIGHTHOUSE ROAD | 2 |
| | | Fire incidents reported |
|---|
| Sreet name | Count |
|---|
| 6063 NUTTING STREET ROAD | 2 | | 7609 ST RT 3 | 2 | | 8544 CO RTE178 | 2 | | 9010 ST RT 178 | 2 | | AYLES RD | 2 | | BAY SHORE DRIVE | 2 | | BAYVIEW DRIVE SOUTH | 2 | | BENS COVE | 2 | | BRODIE ROAD | 2 | | CO RT 71 | 2 | | CO RT 72 | 2 | | CO RT 75 | 2 | | CO RTE 178 | 2 | | CORNER OR AYLES ROAD AND BISHO | 2 | | COUNTY ROUTE 145 | 2 | | COUNTY ROUTE 178 | 2 | | COUNTY ROUTE 78 | 2 | | COUNTY RTE 71&75 | 2 | | DUNBAR ROAD | 2 | | HARBORVIEW DRIVE | 2 | | LASHER RD | 2 | | LIGHTHOUSE RD | 2 | | LOWER GRANDJEAN ROAD | 2 | | LOWER GRANDJEAN TRACT | 2 | | |
|
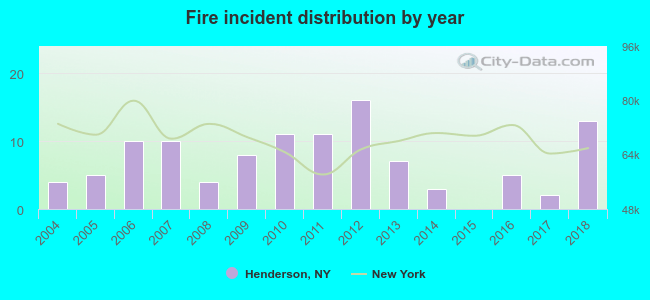 According to the data from the years 2004 - 2018 the average number of fire incidents per year is 7. The highest number of fire incidents - 16 took place in 2012, and the least - 0 in 2015. The data has a growing trend.
 29.4% incidents where reported in the morning and 70.6% in the evening. The most fires (22.0%) took place on Friday, and the least (8.3%) on Thursday.
 According to the 109 incident reports from years 2004 - 2018 most fires (16.5%) took place during April, and the least (1.8%) in October.
 Out of all 532 cases reported during the years 2004 - 2018, the most belonged to the categories: Overpressure Rupture (28.8%), Fire (20.5%), and Rescue & EMS (17.1%).
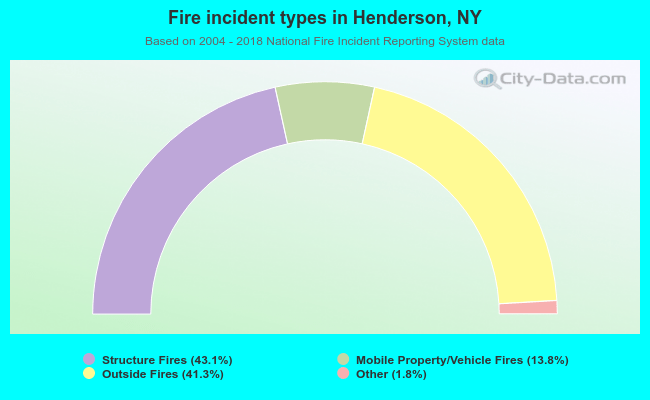 When looking into fire subcategories, the most reports belonged to: Structure Fires (43.1%), and Outside Fires (41.3%).