| Fire incidents reported |
|---|
| Sreet name | Count |
|---|
| 87 HIGH | 8 | | 87 HWY | 8 | | HIGHWAY 87 HWY | 8 | | WADSWORTH | 8 | | 1028 TAXPAYER RD | 4 | | 1147 SALAM CHURCH ROAD | 4 | | 1265 WADSWORTH RD | 4 | | 1314 THUMB ROAD | 4 | | 2188 CRUTCHER RD | 4 | | 356 S MAIN ST | 4 | | 3710 CHICKEN GEORGE TRAIL | 4 | | 4080 CHICKEN GEORGE TRAIL | 4 | | 440 OLD FULTON RD | 4 | | 51 HWY | 4 | | 8801 HWY 87 W. | 4 | | CHICKEN GEORGE TRAIL | 4 | | CHICKEN GEORGE TRL | 4 | | COOPER CREEK RD | 4 | | DOCK BATES | 4 | | EDDIES CV | 4 | | FUTURE CITY RD | 4 | | HWY 209 | 4 | | HWY 51 SOUTH | 4 | | MAIN ST | 4 | | QUEENS CROSSING | 4 |
| | | Fire incidents reported |
|---|
| Sreet name | Count |
|---|
| SUNK LAKE RD | 4 | | 102 SUNK LAKE ROAD | 2 | | 105 FUTER CITY ROAD | 2 | | 105 FUTURE CITY RD | 2 | | 105 FUTURE CITY RD | 2 | | 105 FUTURE CITY ROAD | 2 | | 1079 TAXPAYER ROAD | 2 | | 1100 FAYE BARFEILD | 2 | | 1101 BLOCK LOVELAVE CROSSING | 2 | | 1121 LOVELACE CROSSING | 2 | | 1130 JUNIS LEE RD | 2 | | 1132 DURNVILE RD | 2 | | 1150 LOVELACE CROSSING | 2 | | 1208 HWY 371 | 2 | | 121 VIRGINIA | 2 | | 121 VIRGINIA ST | 2 | | 1278 DURNVILE NUTBUSH | 2 | | 1285 BURKES RD. | 2 | | 1285 JUNIUS LEE RD | 2 | | 1298 CHICKEN GEORGE TRAIL | 2 | | 130 PIPKIN ROAD | 2 | | 1316 CRUTCHER RD | 2 | | 133 LATHAM STRE | 2 | | 133 MAPLE | 2 | | 1332 FAYE BAREFEILD | 2 |
|
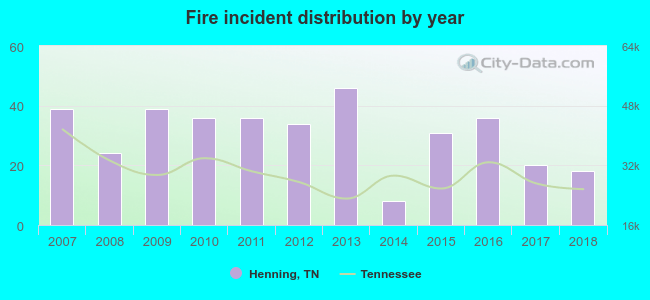 According to the data from the years 2007 - 2018 the average number of fires per year is 31. The highest number of fire incidents - 46 took place in 2013, and the least - 8 in 2014. The data has a dropping trend.
 33.6% incidents where reported in the morning and 66.4% in the evening. The most fires (17.1%) took place on Friday, and the least (9.5%) on Tuesday.
 Based on the 369 reports from years 2007 - 2018 most fires (11.4%) took place during March, and the least (4.9%) in May.
 Out of all 482 cases reported during the years 2007 - 2018, the most belonged to the categories: Fire (76.6%), Service Call (8.1%), and Overpressure Rupture (6.0%).
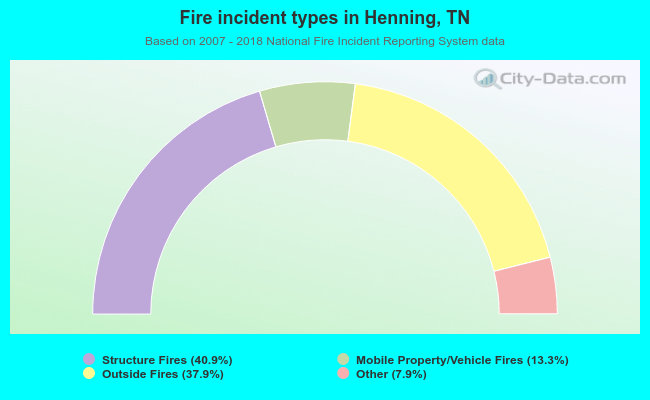 When looking into fire subcategories, the most reports belonged to: Structure Fires (40.9%), and Outside Fires (37.9%).