Hermitage: Fire Incidents, Pennsylvania (PA)
Where are fire incidents reported in Hermitage, PA
Something went wrong! Please refresh the page.
|
| |||||||||||||||||||||||||||||||||||||||||||||||||||||||||||||||||||||||||||||||||||||||||||||||||||||||||||||
2003 - 2018 National Fire Incident Reporting System (NFIRS) incidents
- Incident types reported to NFIRS in Hermitage, PA
- 31825.7%Hazardous Condition
- 26321.3%False Alarm
- 21917.7%Fire
- 21117.1%Service Call
- 816.5%Rescue & EMS
- 756.1%Severe Weather
- 433.5%Special Incident
- 231.9%Good Intent Call
- 40.3%Overpressure Rupture
- Fire incident types reported to NFIRS in Hermitage, PA
- 11351.6%Structure Fires
- 7032.0%Outside Fires
- 2913.2%Mobile Property/Vehicle Fires
- 73.2%Other
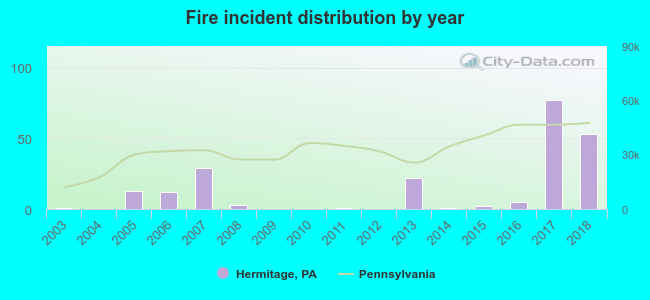 Based on the data from the years 2003 - 2018 the average number of fires per year is 14. The highest number of fires - 77 took place in 2017, and the least - 0 in 2004. The data has an increasing trend.
The average number of yearly fire incidents per 10k residents in Hermitage, PA compared to nearest cities:
(Note: Based on data for the last 3 years, including only cities with population 5,000 and above)
| Hermitage: | 27.9 |
| Sharon: | 56.1 |
| Greenville: | 134.0 |
| New Castle: | 47.7 |
| Grove City: | 32.1 |
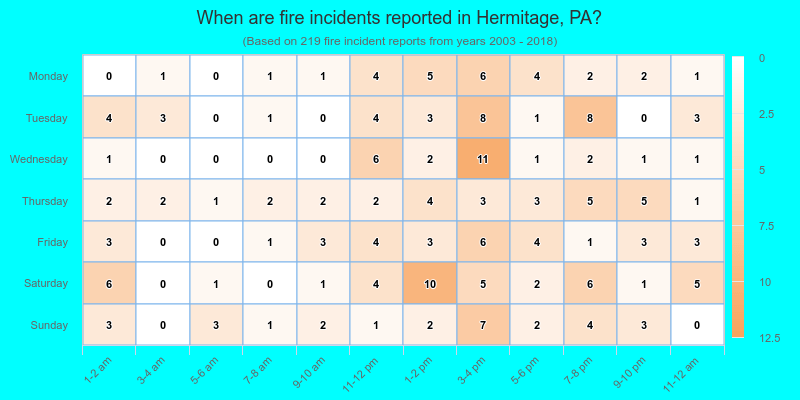
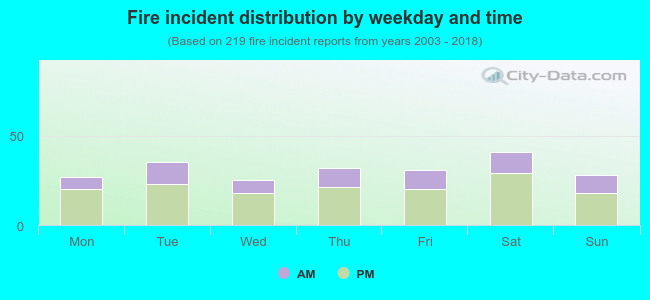 32.0% incidents where reported in the morning and 68.0% in the evening. The most fires (18.7%) took place on Saturday, and the least (11.4%) on Wednesday.
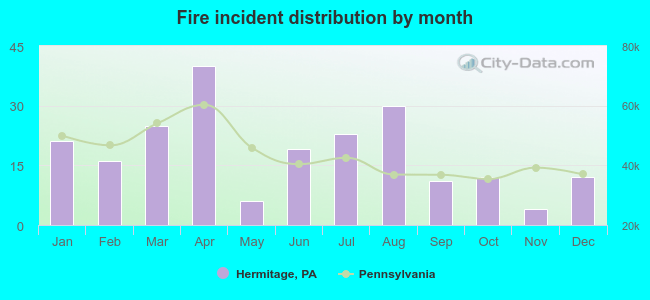 Based on the 219 incident reports from years 2003 - 2018 most fires (18.3%) took place during April, and the least (1.8%) in November.
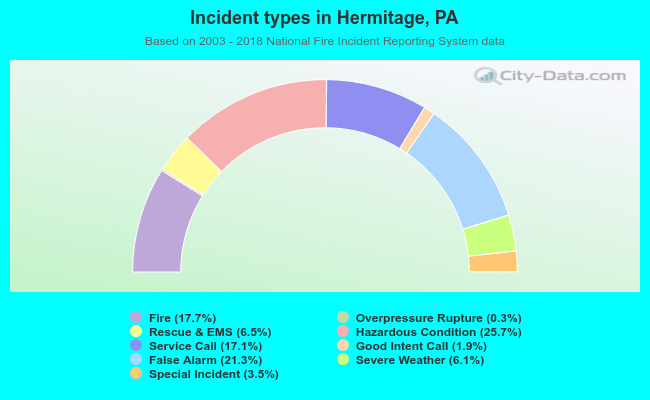 Out of all 1,237 cases reported during the years 2003 - 2018, the most belonged to the categories: Hazardous Condition (25.7%), False Alarm (21.3%), and Fire (17.7%).
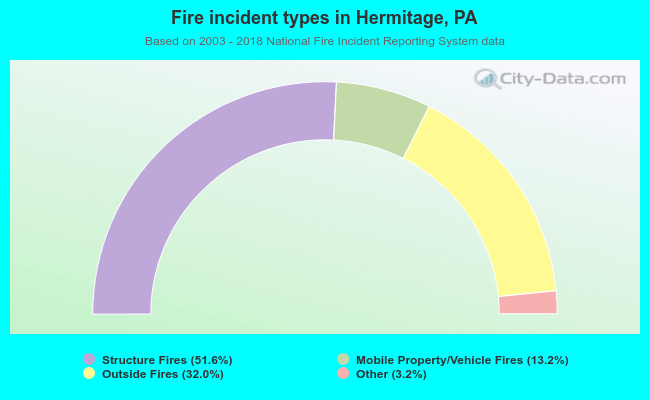 When looking into fire subcategories, the most reports belonged to: Structure Fires (51.6%), and Outside Fires (32.0%).