| Fire incidents reported |
|---|
| Sreet name | Count |
|---|
| SD 79 HWY | 12 | | BOX CANYON RD | 8 | | HIGHWAY 40 | 8 | | HWY 40 | 8 | | GHOST CANYON RD | 6 | | SD 40 HWY | 6 | | 13586 GHOST CANYON RD | 4 | | 13586 GHOST CANYON ROAD | 4 | | 13603 GHOST CANYON ROAD | 4 | | 13913 BOX CANYON | 4 | | 3 ST | 4 | | 3RD ST | 4 | | FAIRGROUNDS PL | 4 | | GHOST CANYON ROAD | 4 | | HEARTLAND / SD79 EXPY | 4 | | HERMOSA FAIRGROUNDS | 4 | | LINTZ BROTHERS PIZZA | 4 | | LOWER SPRING CREEK RD | 4 | | MAIN ST | 4 | | MARGE CT | 4 | | MISSILE RD | 4 | | MISSLE RD | 4 | | OLD FOLSOM RD | 4 | | RED SHIRT | 4 | | SD HIGHWAY 40 | 4 |
| | | Fire incidents reported |
|---|
| Sreet name | Count |
|---|
| VILAS ST | 4 | | 13583 | 2 | | 13586 GHOST CANYON FIRE | 2 | | 13603 | 2 | | 13603 GHOST CANYON | 2 | | 13814 GEORGE | 2 | | 13815 BATTLE CREEK DR | 2 | | 13843 SKYLINE RD | 2 | | 13850 MELVIN RD | 2 | | 13851 SD HWY 40 | 2 | | 13866 BATTLE CREEK RD. | 2 | | 13913 BOX CANYON RD | 2 | | 13973 HWY 36 | 2 | | 14137 MISSLE BASE RD | 2 | | 14468 MISSLE BASE ROAD | 2 | | 15001 LOWER SPRING CREEK RD | 2 | | 15740 HWY 40 | 2 | | 15745 SD HWY 40 | 2 | | 212 VILAS ST | 2 | | 212 VILAS STREET | 2 | | 24157 ALKAN LN | 2 | | 24204 BAUGHEN BACH RD | 2 | | 24229 MARGE CT | 2 | | 24566 HWY 40 | 2 | | |
|
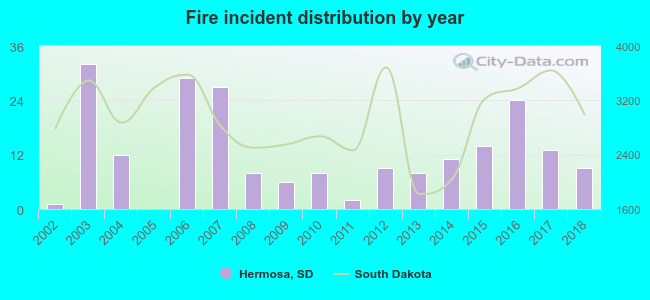 According to the data from the years 2002 - 2018 the average number of fires per year is 13. The highest number of fire incidents - 32 took place in 2003, and the least - 0 in 2005. The data has a rising trend.
 41.8% incidents where reported in the morning and 58.2% in the evening. The most fires (15.5%) took place on Monday, and the least (11.3%) on Sunday.
 Based on the 213 fire incidents from years 2002 - 2018 most fires (16.4%) took place during August, and the least (0.9%) in October.
 Out of all 633 cases reported during the years 2002 - 2018, the most belonged to the categories: Overpressure Rupture (52.0%), Fire (33.6%), and Service Call (10.1%).
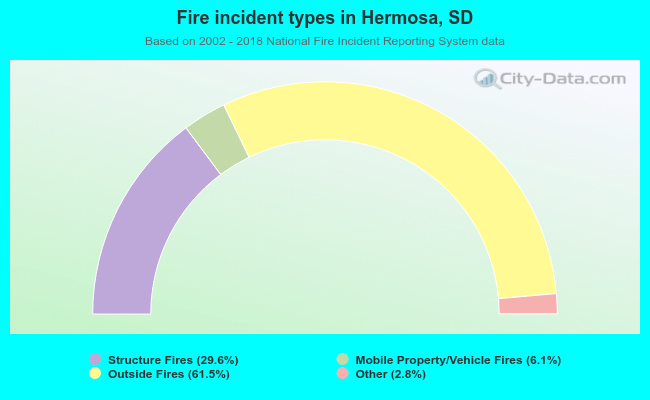 When looking into fire subcategories, the most incidents belonged to: Outside Fires (61.5%), and Structure Fires (29.6%).