Herndon: Fire Incidents, Virginia (VA)
Where are fire incidents reported in Herndon, VA
Something went wrong! Please refresh the page.
|
| |||||||||||||||||||||||||||||||||||||||||||||||||||||||||||||||||||||||||||||||||||||||||||||||||||||||||||||
| Other | 126 | |||||||||||||||||||||||||||||||||||||||||||||||||||||||||||||||||||||||||||||||||||||||||||||||||||||||||||||
2002 - 2018 National Fire Incident Reporting System (NFIRS) incidents
- Incident types reported to NFIRS in Herndon, VA
- 15,90566.2%Rescue & EMS
- 2,88112.0%False Alarm
- 1,8577.7%Good Intent Call
- 1,5756.6%Service Call
- 8483.5%Fire
- 8413.5%Hazardous Condition
- 670.3%Special Incident
- 280.1%Overpressure Rupture
- Fire incident types reported to NFIRS in Herndon, VA
- 40147.3%Structure Fires
- 29835.1%Outside Fires
- 11113.1%Mobile Property/Vehicle Fires
- 384.5%Other
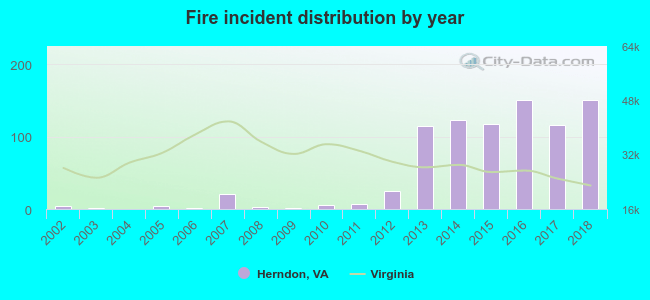 Based on the data from the years 2002 - 2018 the average number of fire incidents per year is 50. The highest number of reported fire incidents - 150 took place in 2016, and the least - 0 in 2004. The data has a rising trend.
The average number of yearly fire incidents per 10k residents in Herndon, VA compared to nearest cities:
(Note: Based on data for the last 3 years, including only cities with population 5,000 and above)
| Herndon: | 56.5 |
| Reston: | 15.5 |
| Sterling: | 37.0 |
| Great Falls: | 20.1 |
| Chantilly: | 39.8 |
| South Riding: | 2.5 |
| Ashburn: | 31.0 |
| Oakton: | 10.0 |
| Vienna: | 45.6 |
 The median response time based on all reported fire incidents is 5 minutes. This is lower compared to the Virginia median value.
The median response time in Herndon, VA compared to nearest cities:
(Note: Based on data for all years, including only cities with at least 500 fire incidents)
| Herndon: | 5 minutes |
| Reston: | 5 minutes |
| Sterling: | 6 minutes |
| Chantilly: | 6 minutes |
| Ashburn: | 6 minutes |
| Vienna: | 5 minutes |
| Centreville: | 6 minutes |
| Fairfax: | 6 minutes |
| McLean: | 6 minutes |
 27.4% incidents where reported in the morning and 72.6% in the evening. The most fires (16.0%) took place on Saturday, and the least (12.0%) on Wednesday.
 According to the 848 reports from years 2002 - 2018 most fires (12.9%) took place during April, and the least (5.5%) in February.
 Out of all 24,009 cases reported during the years 2002 - 2018, the most belonged to the categories: Rescue & EMS (66.2%), False Alarm (12.0%), and Good Intent Call (7.7%).
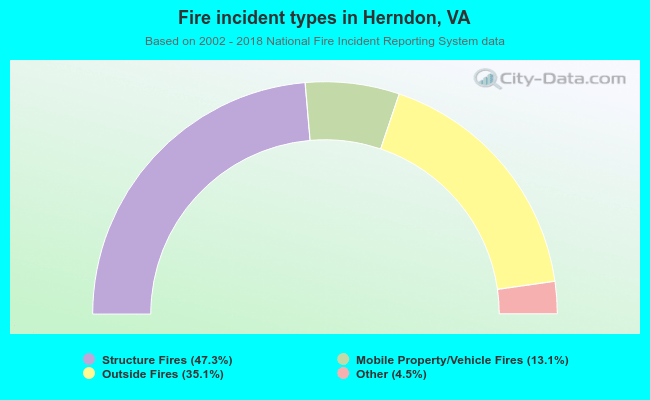 When looking into fire subcategories, the most incidents belonged to: Structure Fires (47.3%), and Outside Fires (35.1%).