| Fire incidents reported |
|---|
| Sreet name | Count |
|---|
| HIGHWAY B | 12 | | HWY B | 12 | | BRADLEY ST | 8 | | CO RD 2480 GRAV | 8 | | GRAND ST | 6 | | 4151 ST RT A | 4 | | CO RD 125 | 4 | | CO RD 2490 GRAV | 4 | | CO RD 2580 GRAV | 4 | | COUNTY RD 2445 | 4 | | COUNTY ROAD 2445 | 4 | | COUNTY ROAD 2560 | 4 | | COUNTY ROAD 2580 | 4 | | COUNTY ROAD 2635 | 4 | | COUNTY ROAD 2930 | 4 | | CR 2560 | 4 | | HIGHWAY A | 4 | | HWY A | 4 | | HWY T | 4 | | JEFFERSON ST | 4 | | PRIVATE ROAD 2944 | 4 | | RAILROAD ST | 4 | | ST RD A PAVE | 4 | | 102 RANDALPH | 2 | | 1141 HIGHWAY T | 2 |
| | | Fire incidents reported |
|---|
| Sreet name | Count |
|---|
| 1240 RANDOLPH CO. RD. 2480 | 2 | | 1350 COUNTY ROAD 2445 | 2 | | 1380 CO. RD. 123 | 2 | | 143 CR 136 | 2 | | 1490 CR 2850 | 2 | | 1823 COUNTY ROAD 2420 | 2 | | 2580 STATE ROUTE U | 2 | | 2641 ST RT O | 2 | | 2875 CO RD 2875 | 2 | | 3332 CR 2250 | 2 | | 3751 COUNTY ROAD 2635 | 2 | | 4040 COUNTY ROAD 2420 | 2 | | 4143 ST. RT. O | 2 | | 4282 ST. RT. O | 2 | | 5080 HWY H | 2 | | 523CR 132 | 2 | | 5785 HWY A | 2 | | 603 CO RD 125 | 2 | | 606 BRADLEY | 2 | | 6822 HWY B | 2 | | A HWY | 2 | | BOX 117 CO RD 2560 GRAV | 2 | | BOX 182 PAVE | 2 | | BOX 21 PAVE | 2 | | |
|
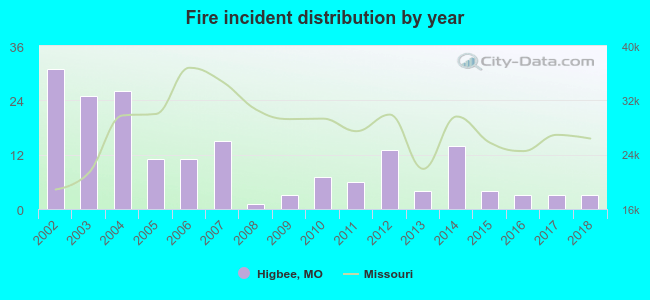 Based on the data from the years 2002 - 2018 the average number of fires per year is 11. The highest number of fires - 31 took place in 2002, and the least - 1 in 2008. The data has a decreasing trend.
 23.9% incidents where reported in the morning and 76.1% in the evening. The most fires (18.3%) took place on Sunday, and the least (9.4%) on Monday.
 Based on the 180 fire incident reports from years 2002 - 2018 most fires (21.1%) took place during March, and the least (0.6%) in September.
 Out of all 231 cases reported during the years 2002 - 2018, the most belonged to the categories: Fire (77.9%), Overpressure Rupture (11.7%), and Service Call (3.5%).
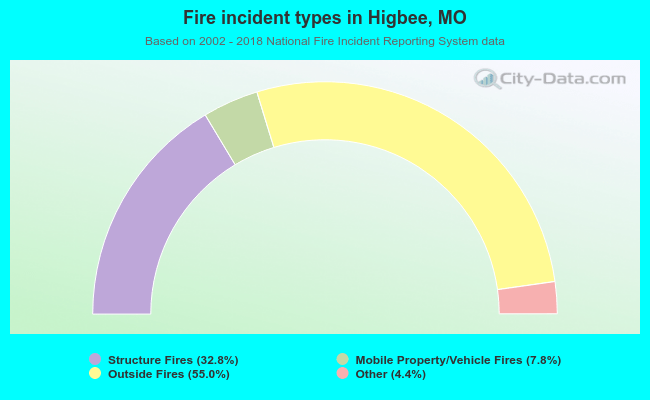 When looking into fire subcategories, the most incidents belonged to: Outside Fires (55.0%), and Structure Fires (32.8%).