Highspire: Fire Incidents, Pennsylvania (PA)
Where are fire incidents reported in Highspire, PA
Something went wrong! Please refresh the page.
|
| |||||||||||||||||||||||||||||||||||||||||||||||||||||||||||||||||||||||||||||||||||||
2005 - 2018 National Fire Incident Reporting System (NFIRS) incidents
- Incident types reported to NFIRS in Highspire, PA
- 18743.6%Fire
- 10925.4%Hazardous Condition
- 6114.2%Good Intent Call
- 327.5%False Alarm
- 214.9%Service Call
- 184.2%Rescue & EMS
- 10.2%Special Incident
- Fire incident types reported to NFIRS in Highspire, PA
- 13773.3%Structure Fires
- 1910.2%Mobile Property/Vehicle Fires
- 1910.2%Other
- 126.4%Outside Fires
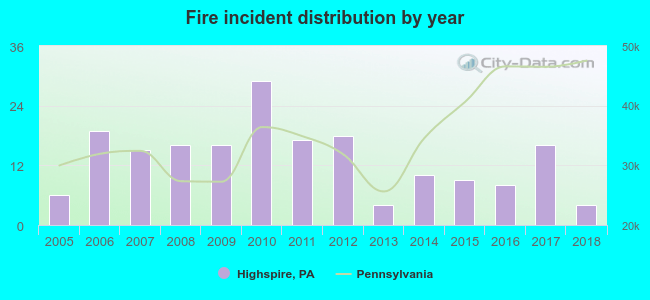 Based on the data from the years 2005 - 2018 the average number of fires per year is 13. The highest number of fires - 29 took place in 2010, and the least - 4 in 2013. The data has a decreasing trend.
 35.3% incidents where reported in the morning and 64.7% in the evening. The most fires (21.9%) took place on Thursday, and the least (9.1%) on Wednesday.
 Based on the 187 incident reports from years 2005 - 2018 most fires (14.4%) took place during November, and the least (2.7%) in August.
 Out of all 429 cases reported during the years 2005 - 2018, the most belonged to the categories: Fire (43.6%), Rescue & EMS (25.4%), and Service Call (14.2%).
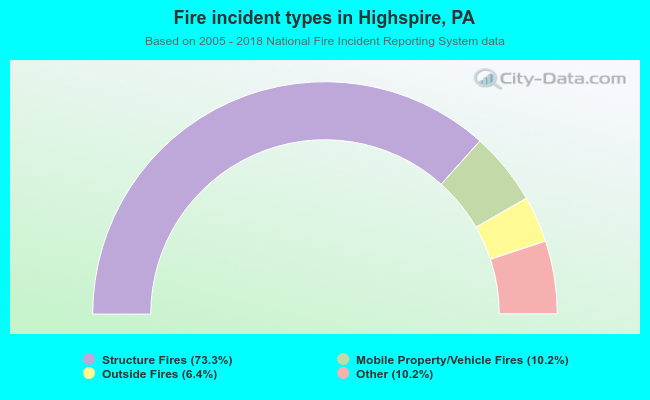 When looking into fire subcategories, the most reports belonged to: Structure Fires (73.3%), and Mobile Property/Vehicle Fires (10.2%).