Hiland Park: Fire Incidents, Florida (FL)
Where are fire incidents reported in Hiland Park, FL
Something went wrong! Please refresh the page.
|
| |||||||||||||||||||||||||||||||||||||||||||||||||||||||||||||||||||||||||||||||||||||||||||||||||||||||||||||
2002 - 2018 National Fire Incident Reporting System (NFIRS) incidents
- Incident types reported to NFIRS in Hiland Park, FL
- 1,02955.2%Rescue & EMS
- 23112.4%Good Intent Call
- 22011.8%Service Call
- 19410.4%Fire
- 904.8%False Alarm
- 623.3%Hazardous Condition
- 271.4%Special Incident
- 60.3%Overpressure Rupture
- 60.3%Severe Weather
- Fire incident types reported to NFIRS in Hiland Park, FL
- 7840.2%Structure Fires
- 6332.5%Outside Fires
- 3317.0%Mobile Property/Vehicle Fires
- 2010.3%Other
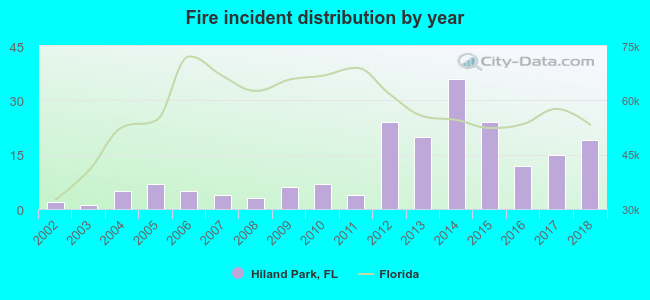 Based on the data from the years 2002 - 2018 the average number of fires per year is 11. The highest number of fires - 36 took place in 2014, and the least - 1 in 2003. The data has a rising trend.
 28.4% incidents where reported in the morning and 71.6% in the evening. The most fires (17.5%) took place on Thursday, and the least (12.9%) on Saturday.
 According to the 194 incident reports from years 2002 - 2018 most fires (12.4%) took place during March, and the least (4.6%) in September.
 Out of all 1,865 cases reported during the years 2002 - 2018, the most belonged to the categories: Rescue & EMS (55.2%), Good Intent Call (12.4%), and Service Call (11.8%).
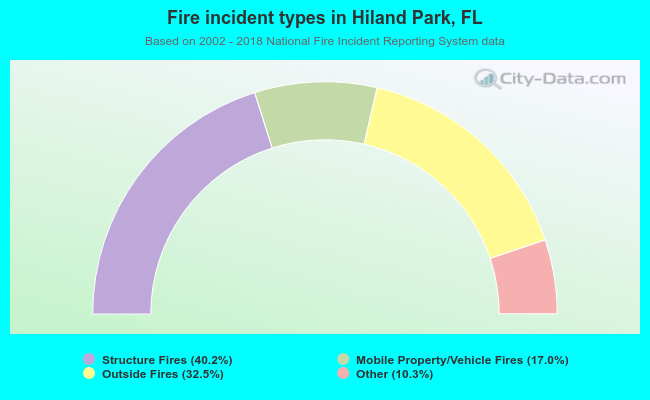 When looking into fire subcategories, the most reports belonged to: Structure Fires (40.2%), and Outside Fires (32.5%).