| Fire incidents reported |
|---|
| Sreet name | Count |
|---|
| 997 SOUTH HIGHWAY 160 | 12 | | BIG BRANCH ROAD | 8 | | HIGHWAY 160 | 8 | | HWY 80 | 8 | | HIGHWAY 160 SOUTH | 6 | | HINDMAN HILLS ROAD | 6 | | 29 ROSE HILL DRIVE | 4 | | 619 HINDMAN BYPASS | 4 | | 80 HWY | 4 | | CORNETT ROAD | 4 | | DAWSON'S BR | 4 | | HOLLY HILLS MALL ROAD | 4 | | HWY 160 | 4 | | KENTUCKY DR | 4 | | KY HWY 160 | 4 | | KY HWY 80 | 4 | | PERKINS MADDEN RD | 4 | | S. HWY 160 | 4 | | WEST HIGHWAY 550 | 4 | | 1323 EAST HIGHWAY 550 | 2 | | 14 WEST MAIN STREET | 2 | | 199 BAKER FORK ROAD | 2 | | 2086 BIG BRANCH ROAD | 2 | | 218 PALM LANE | 2 | | 2189 EAST HIGHWAY 80 | 2 |
| | | Fire incidents reported |
|---|
| Sreet name | Count |
|---|
| 259 WEST HIGHWAY 550 | 2 | | 2724 OGDEN VEST ROAD | 2 | | 296 HERLIN HALCOMB | 2 | | 32 COWTOWN ROAD | 2 | | 3495 SOUTH HIGHWAY 160 | 2 | | 358 BIG BRANCH ROAD | 2 | | 360 HINDMAN BYPASS | 2 | | 3698 WEST HIGHWAY 550 | 2 | | 3765 BIG BRANCH ROAD | 2 | | 38 MISTY MOUNTAIN LANE | 2 | | 388 PERKINS MADDEN ROAD | 2 | | 40 PROMISE LANE | 2 | | 439 PUSH BACK ROAD | 2 | | 4684 BIG BRANCH ROAD | 2 | | 4713 BIG BRANCH ROAD | 2 | | 4870 SOUTH HIGHWAY 160 | 2 | | 50 PROFESSOR CLARK | 2 | | 534 PUSHBACK ROAD | 2 | | 56 EDUCATION LANE | 2 | | 58 WEST HIGHWAY 80 | 2 | | 63 WHITLEY DRIVE | 2 | | 64 CORNETT DRIVE | 2 | | 64 GRAND BABY DRIVE | 2 | | 70 HINDMAN HILLS ROAD | 2 | | 736 HIGHWAY 899 | 2 |
|
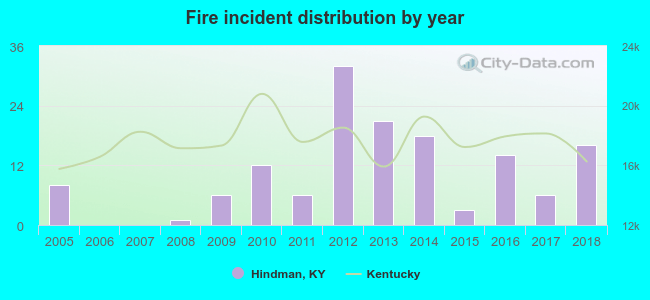 According to the data from the years 2005 - 2018 the average number of fires per year is 10. The highest number of reported fire incidents - 32 took place in 2012, and the least - 0 in 2006. The data has a growing trend.
 36.4% incidents where reported in the morning and 63.6% in the evening. The most fires (19.6%) took place on Monday, and the least (11.9%) on Saturday.
 Based on the 143 fires from years 2005 - 2018 most fires (16.8%) took place during March, and the least (2.8%) in September.
 Out of all 232 cases reported during the years 2005 - 2018, the most belonged to the categories: Fire (61.6%), Rescue & EMS (16.8%), and Good Intent Call (11.2%).
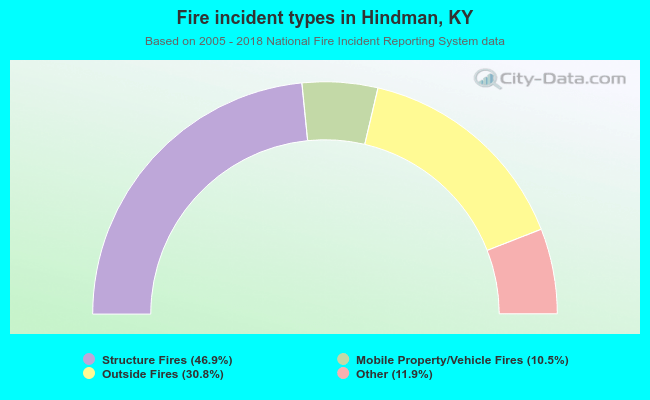 When looking into fire subcategories, the most reports belonged to: Structure Fires (46.9%), and Outside Fires (30.8%).