| Fire incidents reported |
|---|
| Sreet name | Count |
|---|
| US HWY 6 HWY | 10 | | COUNTY ROAD | 8 | | 385 HWY | 4 | | 512 EAST FURRY ST | 4 | | CR RD | 4 | | HWY 6 HWY | 4 | | US 6 HWY | 4 | | US HWY 385 HWY | 4 | | 08004 CR 49 RD | 2 | | 1 WEST 1 1/2 SOUTH XRD | 2 | | 1015 E JOHNSON ST | 2 | | 11 1/2 NORTH 1 1/2 WEST RD | 2 | | 11 E- 3 S -3 E RD | 2 | | 110 NORTH CAMPBELL ST | 2 | | 125 S COLEMAN ST | 2 | | 127 S INTEROCEAN HWY | 2 | | 132N PHELAN ST | 2 | | 16819 CR 35 RD | 2 | | 2 MILES WEST ON HWY 6 HWY | 2 | | 218 S REYNOLDS ST | 2 | | 227 S BELFORD ST | 2 | | 22736 CR 29 RD | 2 | | 236 N CAMPBELL ST | 2 | | 280 N SUNFLOWER DRIVE ST | 2 | | 34801 CO. RD. 59 | 2 |
| | | Fire incidents reported |
|---|
| Sreet name | Count |
|---|
| 4 EAST 6 SOUTH FLD | 2 | | 4 NORTH US 385 HWY | 2 | | 407 SOUTH WORLEY ST | 2 | | 41520 CR 16 RD | 2 | | 43501 CR 24 RD | 2 | | 5 MILES NORTH OF PAOLI RD | 2 | | 5 S 2E RD | 2 | | 5 SOUTH 1 1/2 EAST XRD | 2 | | 5 SOUTH 1/4 EAST RD | 2 | | 511 WEST GORDON ST | 2 | | 541 SOUTH BAXTER ST | 2 | | 545 E HALE ST | 2 | | 58486 CO RD W RD | 2 | | 58500 W RD | 2 | | 601 WEAR GORDON ST | 2 | | 625 SOUTH BOWMAN ST | 2 | | 626 E. DENVER ST | 2 | | 629 S. INTEROCEAN AVE | 2 | | 641 S BAXTER ST | 2 | | 705 S BAXTER ST | 2 | | 730 S BAXTER ST | 2 | | 8 E. 3 S. 1/2E. RD | 2 | | 816 S INTEROCEAN ST | 2 | | 816 SOUTH INTEROCEAN HWY | 2 | | |
|
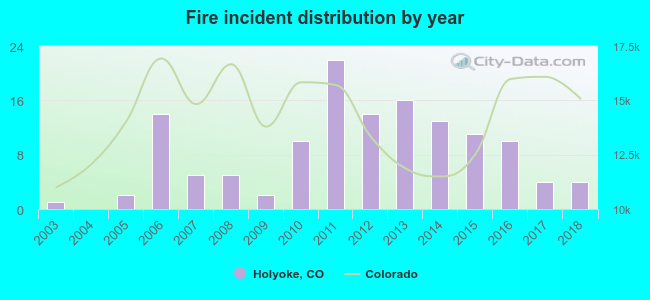 According to the data from the years 2003 - 2018 the average number of fires per year is 8. The highest number of fires - 22 took place in 2011, and the least - 0 in 2004. The data has an increasing trend.
 30.8% incidents where reported in the morning and 69.2% in the evening. The most fires (19.5%) took place on Friday, and the least (12.0%) on Monday.
 According to the 133 incident reports from years 2003 - 2018 most fires (13.5%) took place during March, and the least (2.3%) in January.
 Out of all 228 cases reported during the years 2003 - 2018, the most belonged to the categories: Fire (58.3%), Service Call (25.4%), and Overpressure Rupture (7.9%).
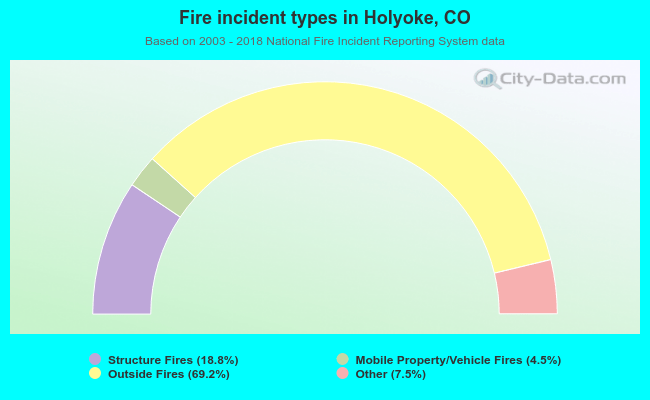 When looking into fire subcategories, the most incidents belonged to: Outside Fires (69.2%), and Structure Fires (18.8%).