Homer: Fire Incidents, Illinois (IL)
Where are fire incidents reported in Homer, IL
Something went wrong! Please refresh the page.
|
| |||||||||||||||||||||||||||||||||||||||||||||||||||||||||||||||||||||||||||||||||||||||||||||||||||||||||||||
2002 - 2018 National Fire Incident Reporting System (NFIRS) incidents
- Incident types reported to NFIRS in Homer, IL
- 49355.6%Rescue & EMS
- 14516.4%Fire
- 12113.7%Service Call
- 546.1%Good Intent Call
- 495.5%Hazardous Condition
- 171.9%False Alarm
- 40.5%Severe Weather
- 20.2%Special Incident
- 10.1%Overpressure Rupture
- Fire incident types reported to NFIRS in Homer, IL
- 9464.8%Structure Fires
- 2819.3%Outside Fires
- 1812.4%Mobile Property/Vehicle Fires
- 53.4%Other
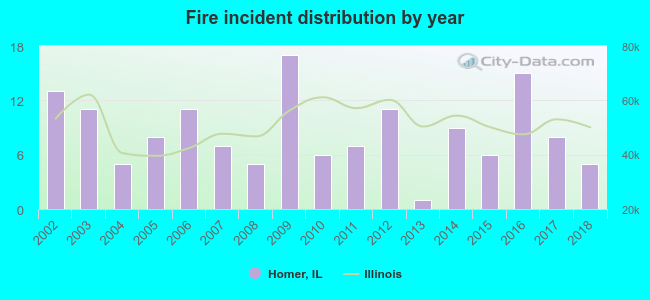 Based on the data from the years 2002 - 2018 the average number of fire incidents per year is 9. The highest number of fire incidents - 17 took place in 2009, and the least - 1 in 2013. The data has a declining trend.
 29.7% incidents where reported in the morning and 70.3% in the evening. The most fires (20.0%) took place on Friday, and the least (9.0%) on Saturday.
 According to the 145 incident reports from years 2002 - 2018 most fires (17.9%) took place during March, and the least (1.4%) in July.
 Out of all 886 cases reported during the years 2002 - 2018, the most belonged to the categories: Rescue & EMS (55.6%), Fire (16.4%), and Service Call (13.7%).
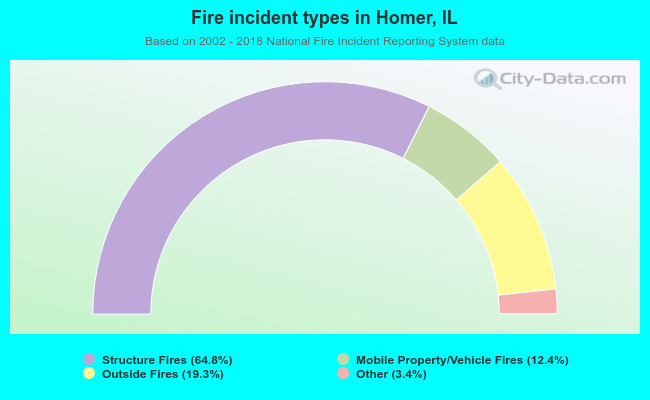 When looking into fire subcategories, the most incidents belonged to: Structure Fires (64.8%), and Outside Fires (19.3%).