Hooper: Fire Incidents, Utah (UT)
Where are fire incidents reported in Hooper, UT
Something went wrong! Please refresh the page.
|
| |||||||||||||||||||||||||||||||||||||||||||||||||||||||||||||||||||||||||||||||||||||||||||||||||||||||||||||
2002 - 2018 National Fire Incident Reporting System (NFIRS) incidents
- Incident types reported to NFIRS in Hooper, UT
- 1,29259.2%Rescue & EMS
- 31714.5%Good Intent Call
- 30113.8%Fire
- 984.5%Hazardous Condition
- 974.4%False Alarm
- 693.2%Service Call
- 50.2%Special Incident
- 30.1%Overpressure Rupture
- Fire incident types reported to NFIRS in Hooper, UT
- 15150.2%Outside Fires
- 8929.6%Structure Fires
- 3511.6%Other
- 268.6%Mobile Property/Vehicle Fires
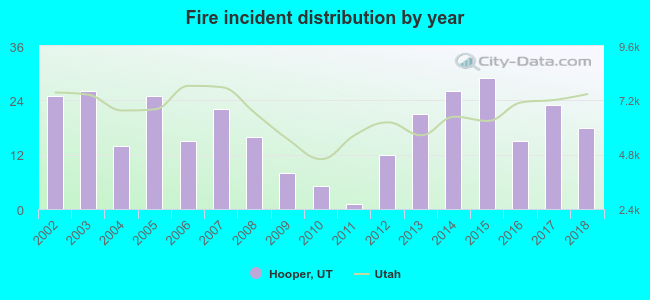 According to the data from the years 2002 - 2018 the average number of fires per year is 18. The highest number of reported fires - 29 took place in 2015, and the least - 1 in 2011. The data has a declining trend.
The average number of yearly fire incidents per 10k residents in Hooper, UT compared to nearest cities:
(Note: Based on data for the last 3 years, including only cities with population 5,000 and above)
| Hooper: | 23.0 |
| West Point: | 23.8 |
| Roy: | 20.1 |
| Clinton: | 20.5 |
| West Haven: | 40.6 |
| Sunset: | 30.4 |
| Riverdale: | 33.0 |
| Syracuse: | 10.4 |
| Clearfield: | 29.2 |
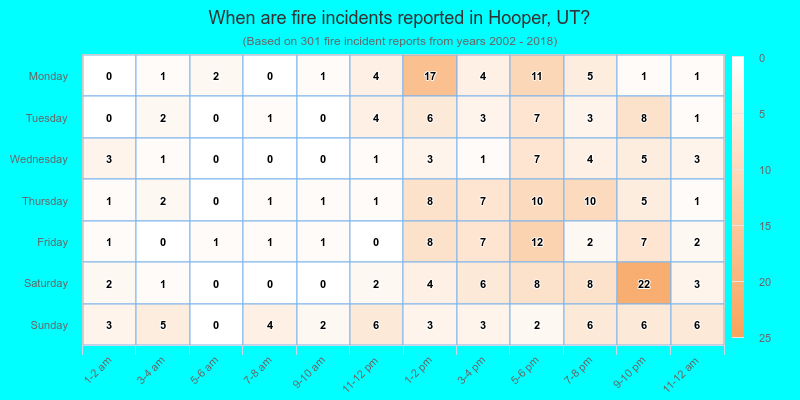
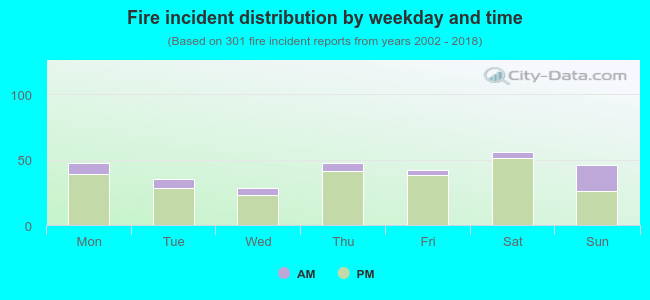 18.3% incidents where reported in the morning and 81.7% in the evening. The most fires (18.6%) took place on Saturday, and the least (9.3%) on Wednesday.
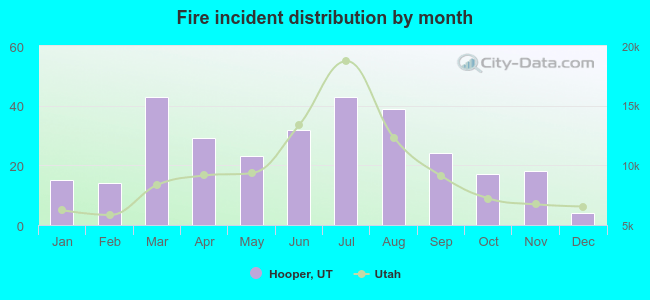 Based on the 301 fire incident reports from years 2002 - 2018 most fires (14.3%) took place during March, and the least (1.3%) in December.
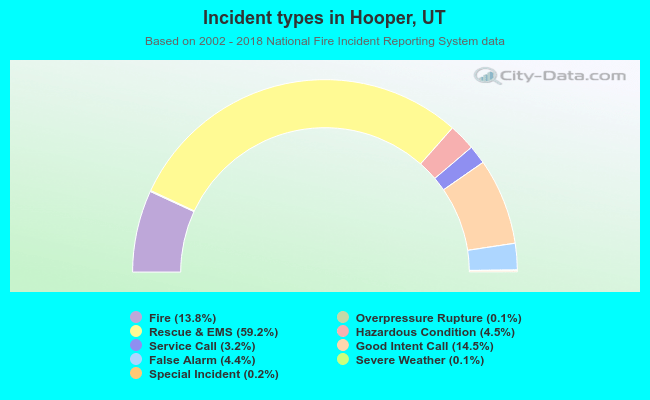 Out of all 2,184 cases reported during the years 2002 - 2018, the most belonged to the categories: Rescue & EMS (59.2%), Good Intent Call (14.5%), and Fire (13.8%).
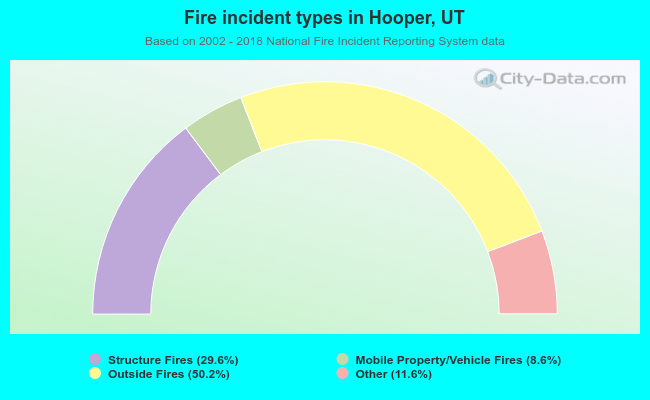 When looking into fire subcategories, the most reports belonged to: Outside Fires (50.2%), and Structure Fires (29.6%).