Hopkinton: Fire Incidents, Massachusetts (MA)
Where are fire incidents reported in Hopkinton, MA
Something went wrong! Please refresh the page.
| Fire incidents reported | |
|---|---|
| Sreet name | Count |
| HAYDEN ROWE ST | 84 |
| WEST MAIN ST | 84 |
| MAIN ST | 78 |
| SOUTH ST | 66 |
| WEST MAIN ST | 66 |
| WOOD ST | 66 |
| 495 SEC1 HWY | 38 |
| ASH ST | 38 |
| LUMBER ST | 38 |
| EAST MAIN ST | 34 |
| 495 SEC 2 HWY | 32 |
| DAVIS RD | 28 |
| HAYDEN ROWE ST | 26 |
| I-495 HWY | 24 |
| WOOD ST | 24 |
| 495 SEC 3 HWY | 22 |
| CEDAR ST | 22 |
| CLINTON ST | 22 |
| EAST ST | 22 |
| MAYHEW ST | 22 |
| SPRING ST | 22 |
| WILSON ST | 22 |
| 495 SEC 4 HWY | 20 |
| DOWNEY ST | 20 |
| GREENWOOD RD | 20 |
| HAYWARD ST | 20 |
| POND ST | 20 |
| SADDLE HILL RD | 20 |
| FRONT ST | 18 |
| FRUIT ST | 18 |
| Other | 110 |
2002 - 2018 National Fire Incident Reporting System (NFIRS) incidents
- Incident types reported to NFIRS in Hopkinton, MA
- 4,80644.9%Rescue & EMS
- 2,07219.3%Hazardous Condition
- 1,20911.3%False Alarm
- 1,14610.7%Fire
- 8177.6%Service Call
- 6045.6%Good Intent Call
- 320.3%Special Incident
- 140.1%Overpressure Rupture
- Fire incident types reported to NFIRS in Hopkinton, MA
- 59852.2%Structure Fires
- 32328.2%Outside Fires
- 18015.7%Mobile Property/Vehicle Fires
- 453.9%Other
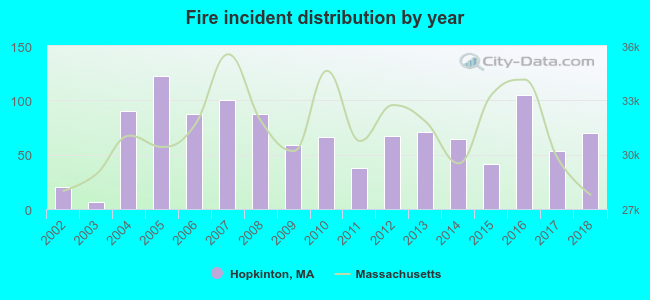 Based on the data from the years 2002 - 2018 the average number of fires per year is 67. The highest number of fires - 122 took place in 2005, and the least - 6 in 2003. The data has an increasing trend.
 The median response time based on all reported fire incidents is 6 minutes. This is higher than the Massachusetts median value.
The median response time in Hopkinton, MA compared to nearest cities:
(Note: Based on data for all years, including only cities with at least 500 fire incidents)
| Hopkinton: | 6 minutes |
| Southborough: | 6 minutes |
| Milford: | 5 minutes |
| Upton: | 5 minutes |
| Westborough: | 5 minutes |
| Framingham: | 4 minutes |
| Marlborough: | 5 minutes |
| Northborough: | 6 minutes |
| Bellingham: | 7 minutes |
 Based on the data from the years 2002 - 2018 the average number of fire-related fatalities per year is 0. The highest number of reported deaths - 2 took place in 2002, and the lowest - 0 in 2003. The data has a declining trend.
 Based on the data from the years 2002 - 2018 the average number of fire-related casualties per year is 1. The highest number of reported injuries - 3 took place in 2007, and the lowest - 0 in 2003. The data has a declining trend.
The average number of casualties per 1,000 fires is 9. This indicator was the highest - 50 in 2002, and the lowest 0 in 2003. The trend for casualties per 1,000 fire incidents is dropping. Compared to the state value the number of injuries per 1,000 fire incidents is lower.
Based on the data from the years 2002 - 2018 the average number of fire-related casualties per year is 1. The highest number of reported injuries - 3 took place in 2007, and the lowest - 0 in 2003. The data has a declining trend.
The average number of casualties per 1,000 fires is 9. This indicator was the highest - 50 in 2002, and the lowest 0 in 2003. The trend for casualties per 1,000 fire incidents is dropping. Compared to the state value the number of injuries per 1,000 fire incidents is lower.Casualties per 1,000 incidents in Hopkinton, MA compared to nearest cities:
(Note: Based on data for all years, including only cities with at least 500 fire incidents)
| Hopkinton: | 8.7 |
| Southborough: | 16.8 |
| Milford: | 25.0 |
| Upton: | 1.6 |
| Westborough: | 10.5 |
| Framingham: | 8.3 |
| Marlborough: | 21.3 |
| Northborough: | 18.2 |
| Bellingham: | 12.0 |
 29.7% incidents where reported in the morning and 70.3% in the evening. The most fires (15.9%) took place on Thursday, and the least (12.7%) on Tuesday.
 Based on the 1,146 reports from years 2002 - 2018 most fires (13.8%) took place during April, and the least (5.9%) in September.
 Out of all 10,709 cases reported during the years 2002 - 2018, the most belonged to the categories: Rescue & EMS (44.9%), Hazardous Condition (19.3%), and False Alarm (11.3%).
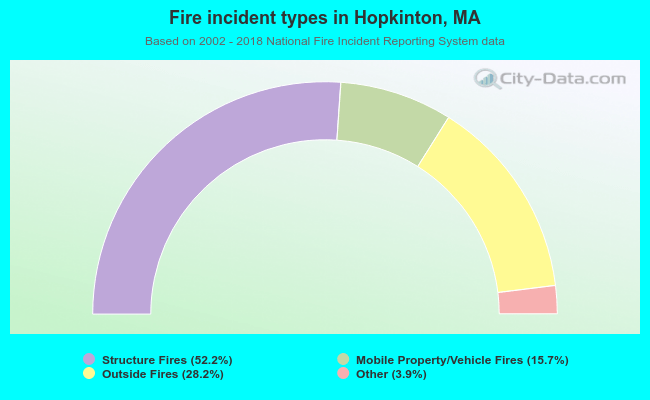 When looking into fire subcategories, the most incidents belonged to: Structure Fires (52.2%), and Outside Fires (28.2%).