Horizon City: Fire Incidents, Texas (TX)
Where are fire incidents reported in Horizon City, TX
Something went wrong! Please refresh the page.
|
| |||||||||||||||||||||||||||||||||||||||||||||||||||||||||||||||||||||||||||||||||||||||||||||||||||||||||||||
| Other | 218 | |||||||||||||||||||||||||||||||||||||||||||||||||||||||||||||||||||||||||||||||||||||||||||||||||||||||||||||
2006 - 2018 National Fire Incident Reporting System (NFIRS) incidents
- Incident types reported to NFIRS in Horizon City, TX
- 4,76963.5%Rescue & EMS
- 78010.4%Fire
- 6438.6%Good Intent Call
- 5877.8%Service Call
- 3765.0%Hazardous Condition
- 3254.3%False Alarm
- 160.2%Special Incident
- 110.1%Overpressure Rupture
- Fire incident types reported to NFIRS in Horizon City, TX
- 36747.1%Outside Fires
- 19224.6%Structure Fires
- 13016.7%Other
- 9111.7%Mobile Property/Vehicle Fires
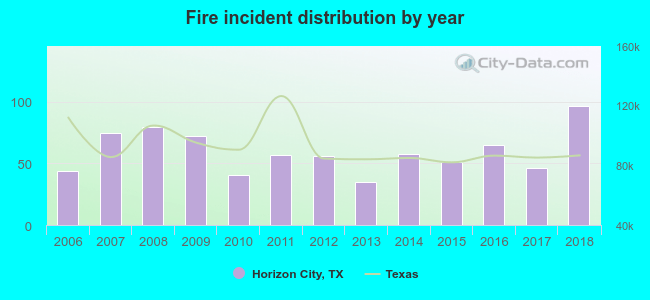 Based on the data from the years 2006 - 2018 the average number of fire incidents per year is 60. The highest number of reported fire incidents - 97 took place in 2018, and the least - 35 in 2013. The data has a rising trend.
The average number of yearly fire incidents per 10k residents in Horizon City, TX compared to nearest cities:
(Note: Based on data for the last 3 years, including only cities with population 5,000 and above)
| Horizon City: | 35.9 |
| Socorro: | 5.4 |
| San Elizario: | 6.6 |
| Fabens: | 58.5 |
| El Paso: | 9.8 |
| Fort Bliss: | 4.1 |
| Canutillo: | 61.2 |
| Anthony: | 41.8 |
 The median response time based on all reported fire incidents is 7 minutes. This is comparable to the state median value.
The median response time in Horizon City, TX compared to nearest cities:
(Note: Based on data for all years, including only cities with at least 500 fire incidents)
| Horizon City: | 7 minutes |
| Socorro: | 8 minutes |
| Clint: | 10 minutes |
| El Paso: | 6 minutes |
| Chaparral: | 8 minutes |
| Canutillo: | 6 minutes |
| Anthony: | 12 minutes |
| Las Cruces: | 6 minutes |
| Alamogordo: | 5 minutes |
 23.1% incidents where reported in the morning and 76.9% in the evening. The most fires (16.4%) took place on Wednesday, and the least (11.7%) on Monday.
 Based on the 780 fires from years 2006 - 2018 most fires (16.7%) took place during July, and the least (5.1%) in August.
 Out of all 7,511 cases reported during the years 2006 - 2018, the most belonged to the categories: Rescue & EMS (63.5%), Fire (10.4%), and Good Intent Call (8.6%).
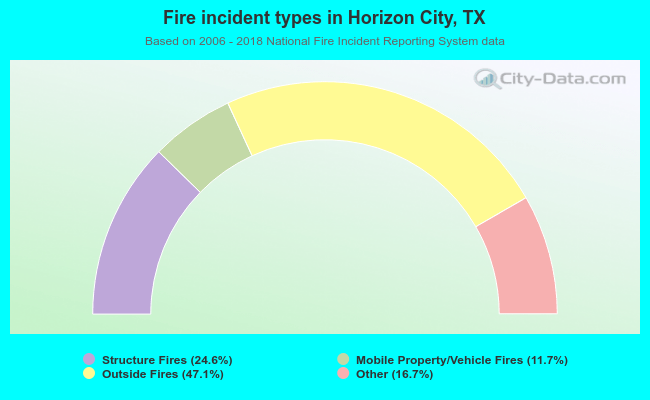 When looking into fire subcategories, the most incidents belonged to: Outside Fires (47.1%), and Structure Fires (24.6%).