Hornell: Fire Incidents, New York (NY)
Where are fire incidents reported in Hornell, NY
Something went wrong! Please refresh the page.
|
| |||||||||||||||||||||||||||||||||||||||||||||||||||||||||||||||||||||||||||||||||||||||||||||||||||||||||||||
2004 - 2018 National Fire Incident Reporting System (NFIRS) incidents
- Incident types reported to NFIRS in Hornell, NY
- 91169.6%Hazardous Condition
- 21316.3%Fire
- 695.3%Service Call
- 322.4%Rescue & EMS
- 312.4%False Alarm
- 302.3%Good Intent Call
- 191.5%Severe Weather
- 40.3%Special Incident
- Fire incident types reported to NFIRS in Hornell, NY
- 9645.1%Other
- 6430.0%Structure Fires
- 3817.8%Outside Fires
- 157.0%Mobile Property/Vehicle Fires
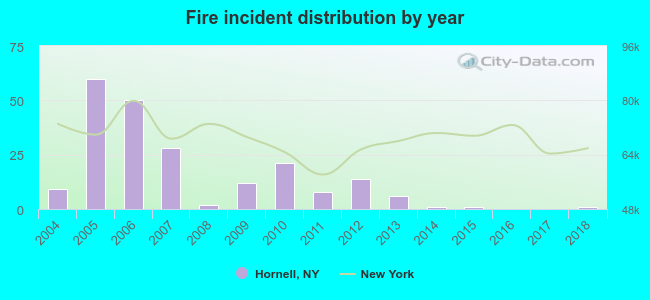 Based on the data from the years 2004 - 2018 the average number of fires per year is 14. The highest number of fire incidents - 60 took place in 2005, and the least - 0 in 2016. The data has a decreasing trend.
The average number of yearly fire incidents per 10k residents in Hornell, NY compared to nearest cities:
(Note: Based on data for the last 3 years, including only cities with population 5,000 and above)
| Hornell: | 1.2 |
| Bath: | 100.8 |
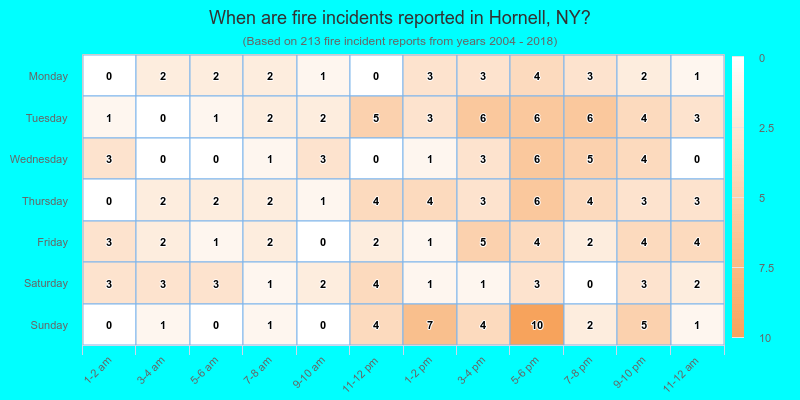
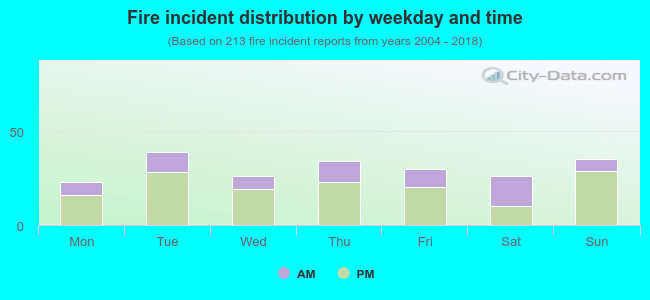 31.9% incidents where reported in the morning and 68.1% in the evening. The most fires (18.3%) took place on Tuesday, and the least (10.8%) on Monday.
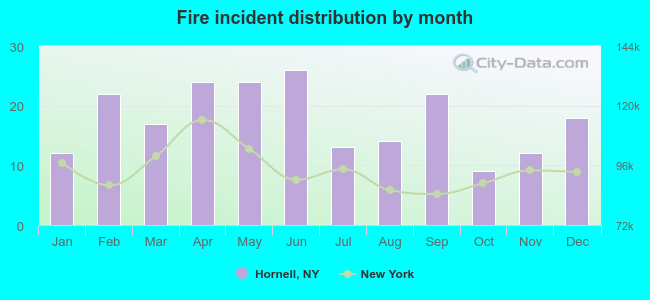 According to the 213 fires from years 2004 - 2018 most fires (12.2%) took place during June, and the least (4.2%) in October.
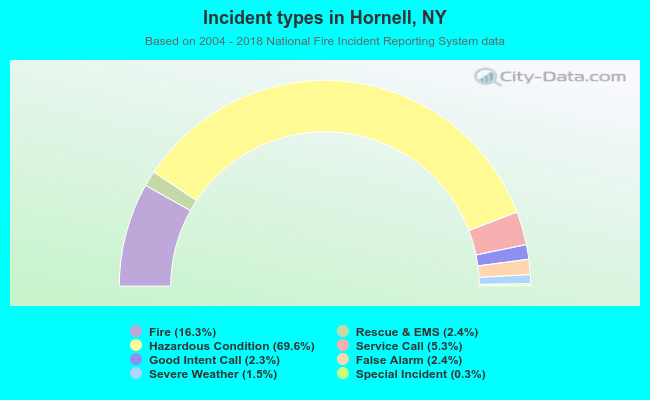 Out of all 1,309 cases reported during the years 2004 - 2018, the most belonged to the categories: Rescue & EMS (69.6%), Fire (16.3%), and Hazardous Condition (5.3%).
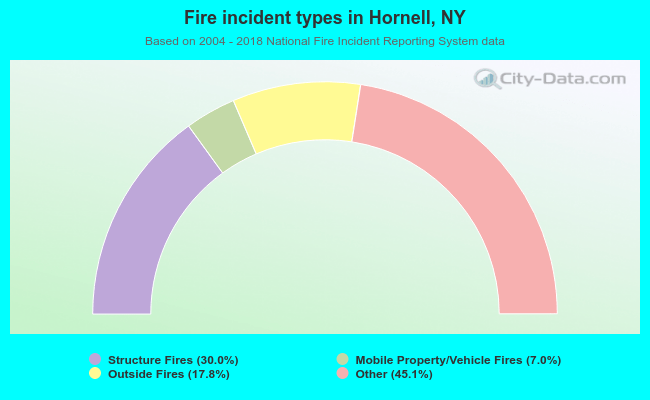 When looking into fire subcategories, the most incidents belonged to: Other (45.1%), and Structure Fires (30.0%).