| Fire incidents reported |
|---|
| Sreet name | Count |
|---|
| MCKENNA RD | 14 | | WASHINGTON ST | 12 | | HUBBARDSTON RD | 10 | | ISLAND RD | 6 | | 10623 MCKENNA RD. | 4 | | 15019 MAPLE RAPIDS RD. | 4 | | 228 N WASHINGTON ST. | 4 | | 6491 HOGAN RD. | 4 | | 6538 BRICKER RD. | 4 | | 7387 MCKENNA RD. | 4 | | BRAYTON RD | 4 | | BRICKER RD | 4 | | CHARLES RD | 4 | | CRYSTAL RD | 4 | | HUBBARDSTON | 4 | | STRUBLE RD | 4 | | TAYLOR ST | 4 | | 10184 MCKENNA RD. | 2 | | 10454 MCKENNA RD. | 2 | | 10665 MCKENNA RD. | 2 | | 11215 STOUDT RD. | 2 | | 11961 STOUDT RD | 2 | | 11961 STOUDT RD. | 2 | | 12900 WEST MAPLE RAPIDS | 2 | | 14335 COOK RD. | 2 |
| | | Fire incidents reported |
|---|
| Sreet name | Count |
|---|
| 14825 ISLAND RD | 2 | | 15858 STONE RD. | 2 | | 15960 JARVIS ST. | 2 | | 244 S. WASHINGTON ST. | 2 | | 249 PLEASANT ST. | 2 | | 275 HOMER ST. | 2 | | 297 HOMER ST. | 2 | | 321 PEARL ST. | 2 | | 370 CHURCH ST | 2 | | 3759 HUBBARDSTON RD | 2 | | 441 W PLEASANT ST. | 2 | | 465 W. PLEASANT ST. | 2 | | 500 N WASHINGTON ST | 2 | | 5108 BRAYTON RD | 2 | | 5351 SCHAEFFER | 2 | | 5351 SCHAEFFER RD. | 2 | | 537 N. WASHINGTON ST. | 2 | | 5592 JARVIS ST | 2 | | 5592 JARVIS ST. | 2 | | 5635 HAYES RD. | 2 | | 5737 HUBBARDSTON RD | 2 | | 5833 HUBBARDSTON RD. | 2 | | 5975 HUBBARDSTON RD. | 2 | | 600 N. WASHINGTON ST. | 2 | | |
|
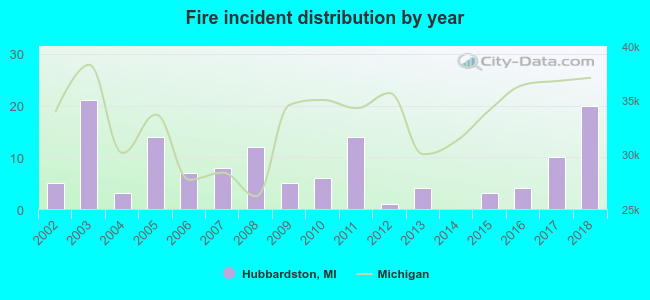 Based on the data from the years 2002 - 2018 the average number of fires per year is 8. The highest number of fires - 21 took place in 2003, and the least - 0 in 2014. The data has an increasing trend.
 24.1% incidents where reported in the morning and 75.9% in the evening. The most fires (20.4%) took place on Sunday, and the least (6.6%) on Wednesday.
 Based on the 137 fire incident reports from years 2002 - 2018 most fires (27.0%) took place during April, and the least (0.7%) in February.
 Out of all 668 cases reported during the years 2002 - 2018, the most belonged to the categories: Rescue & EMS (31.1%), Service Call (24.7%), and Fire (20.5%).
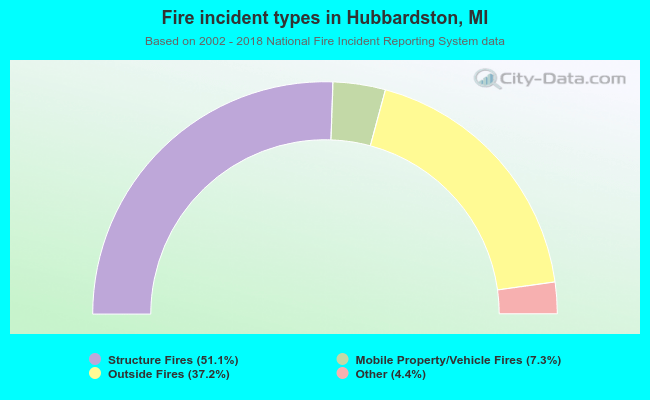 When looking into fire subcategories, the most reports belonged to: Structure Fires (51.1%), and Outside Fires (37.2%).