Hughes: Fire Incidents, Arkansas (AR)
Where are fire incidents reported in Hughes, AR
Something went wrong! Please refresh the page.
|
| |||||||||||||||||||||||||||||||||||||||||||||||||||||||||||||||||||||||||||||||||||||||||||||||||||||||||||||
| Other | 279 | |||||||||||||||||||||||||||||||||||||||||||||||||||||||||||||||||||||||||||||||||||||||||||||||||||||||||||||
2002 - 2018 National Fire Incident Reporting System (NFIRS) incidents
- Incident types reported to NFIRS in Hughes, AR
- 63754.5%Fire
- 33328.5%Rescue & EMS
- 13311.4%Hazardous Condition
- 262.2%Good Intent Call
- 191.6%False Alarm
- 121.0%Service Call
- 40.3%Overpressure Rupture
- 30.3%Special Incident
- Fire incident types reported to NFIRS in Hughes, AR
- 30047.1%Outside Fires
- 19831.1%Structure Fires
- 11818.5%Mobile Property/Vehicle Fires
- 213.3%Other
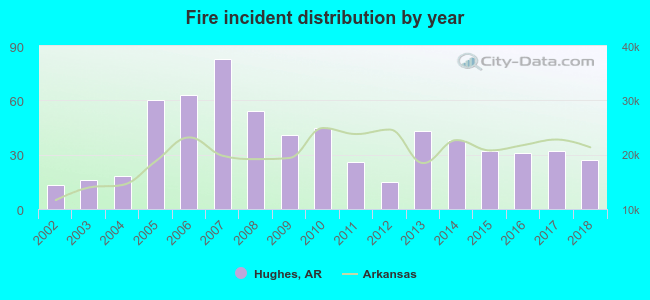 Based on the data from the years 2002 - 2018 the average number of fire incidents per year is 37. The highest number of reported fires - 83 took place in 2007, and the least - 13 in 2002. The data has an increasing trend.
 The median response time based on all reported fire incidents is 5 minutes. This is lower than the state median value.
The median response time in Hughes, AR compared to nearest cities:
(Note: Based on data for all years, including only cities with at least 500 fire incidents)
| Hughes: | 5 minutes |
| Forrest City: | 4 minutes |
| Marianna: | 5 minutes |
| West Memphis: | 5 minutes |
| Earle: | 5 minutes |
| Marion: | 7 minutes |
| Wynne: | 4 minutes |
| West Helena: | 3 minutes |
| Helena-West Helena: | 3 minutes |
 29.4% incidents where reported in the morning and 70.6% in the evening. The most fires (16.8%) took place on Saturday, and the least (12.4%) on Sunday.
 Based on the 637 fires from years 2002 - 2018 most fires (12.4%) took place during June, and the least (4.1%) in December.
 Out of all 1,168 cases reported during the years 2002 - 2018, the most belonged to the categories: Fire (54.5%), Rescue & EMS (28.5%), and Hazardous Condition (11.4%).
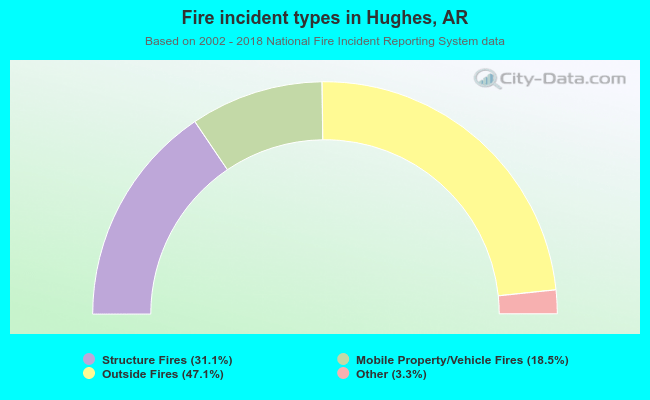 When looking into fire subcategories, the most incidents belonged to: Outside Fires (47.1%), and Structure Fires (31.1%).